Truist Financial Corp Results Presentation Deck
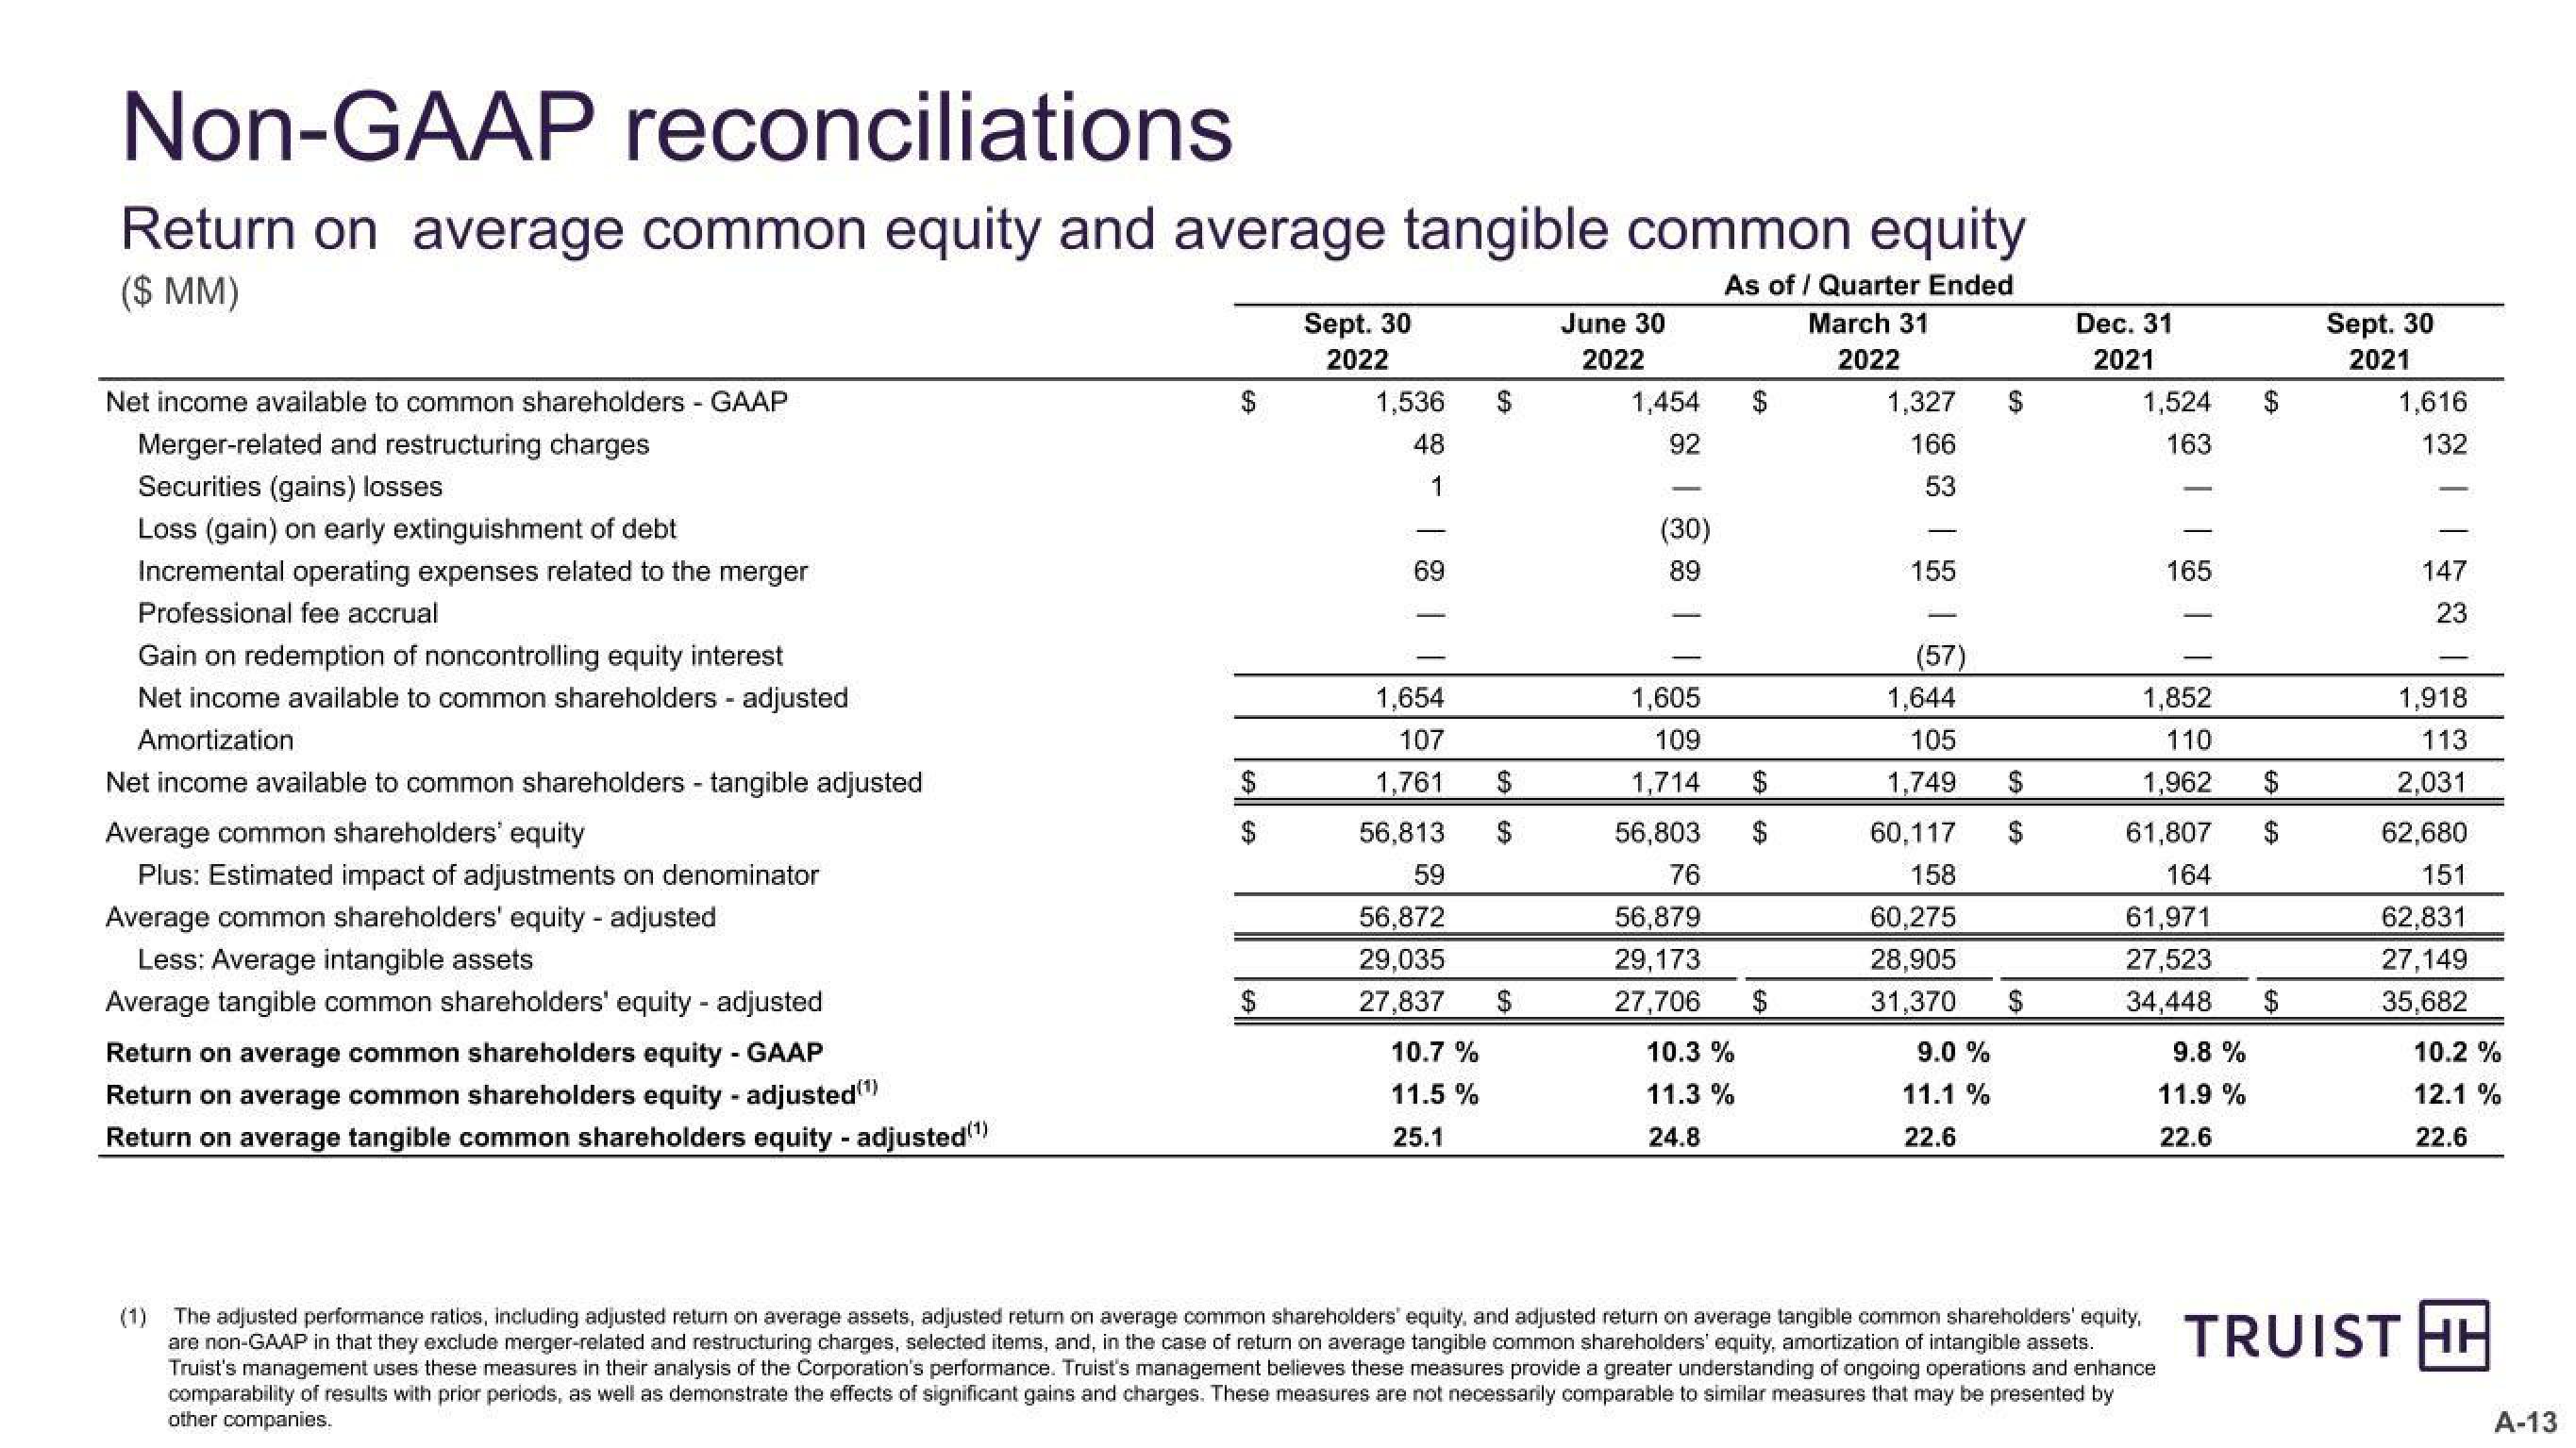
Non-GAAP reconciliations
Return on average common equity and average tangible common equity
($ MM)
As of/ Quarter Ended
March 31
2022
Net income available to common shareholders - GAAP
Merger-related and restructuring charges
Securities (gains) losses
Loss (gain) on early extinguishment of debt
Incremental operating expenses related to the merger
Professional fee accrual
Gain on redemption of noncontrolling equity interest
Net income available to common shareholders - adjusted
Amortization
Net income available to common shareholders - tangible adjusted
Average common shareholders' equity
Plus: Estimated impact of adjustments on denominator
Average common shareholders' equity - adjusted
Less: Average intangible assets
Average tangible common shareholders' equity - adjusted
Return on average common shareholders equity - GAAP
Return on average common shareholders equity - adjusted (¹)
Return on average tangible common shareholders equity - adjusted(¹)
$
$
Sept. 30
2022
1,536
48
1
| |
69
1,654
107
1,761 $
56,813 $
59
56,872
29,035
27,837
10.7 %
11.5%
25.1
$
June 30
2022
1,454
92
(30)
89
1,605
109
1,714
56,803
76
56,879
29,173
27,706
10.3 %
11.3%
24.8
$
$
1,327
166
53
155
(57)
$
1,644
105
1,749
60,117
158
60,275
28,905
31,370 $
9.0 %
11.1 %
22.6
$
$
Dec. 31
2021
1,524
163
165
1,852
110
1,962
61,807
164
61,971
27,523
34,448
9.8 %
11.9%
22.6
(1) The adjusted performance ratios, including adjusted return on average assets, adjusted return on average common shareholders' equity, and adjusted return on average tangible common shareholders' equity,
are non-GAAP in that they exclude merger-related and restructuring charges, selected items, and, in the case of return on average tangible common shareholders' equity, amortization of intangible assets.
Truist's management uses these measures in their analysis of the Corporation's performance. Truist's management believes these measures provide a greater understanding of ongoing operations and enhance
comparability of results with prior periods, as well as demonstrate the effects of significant gains and charges. These measures are not necessarily comparable to similar measures that may be presented by
other companies.
$
69
$
$
Sept. 30
2021
1,616
132
147
23
1,918
113
2,031
62,680
151
62,831
27,149
35,682
10.2 %
12.1 %
22.6
TRUIST HE
A-13View entire presentation