J.P.Morgan Investment Banking Pitch Book
VALUATION ANALYSIS
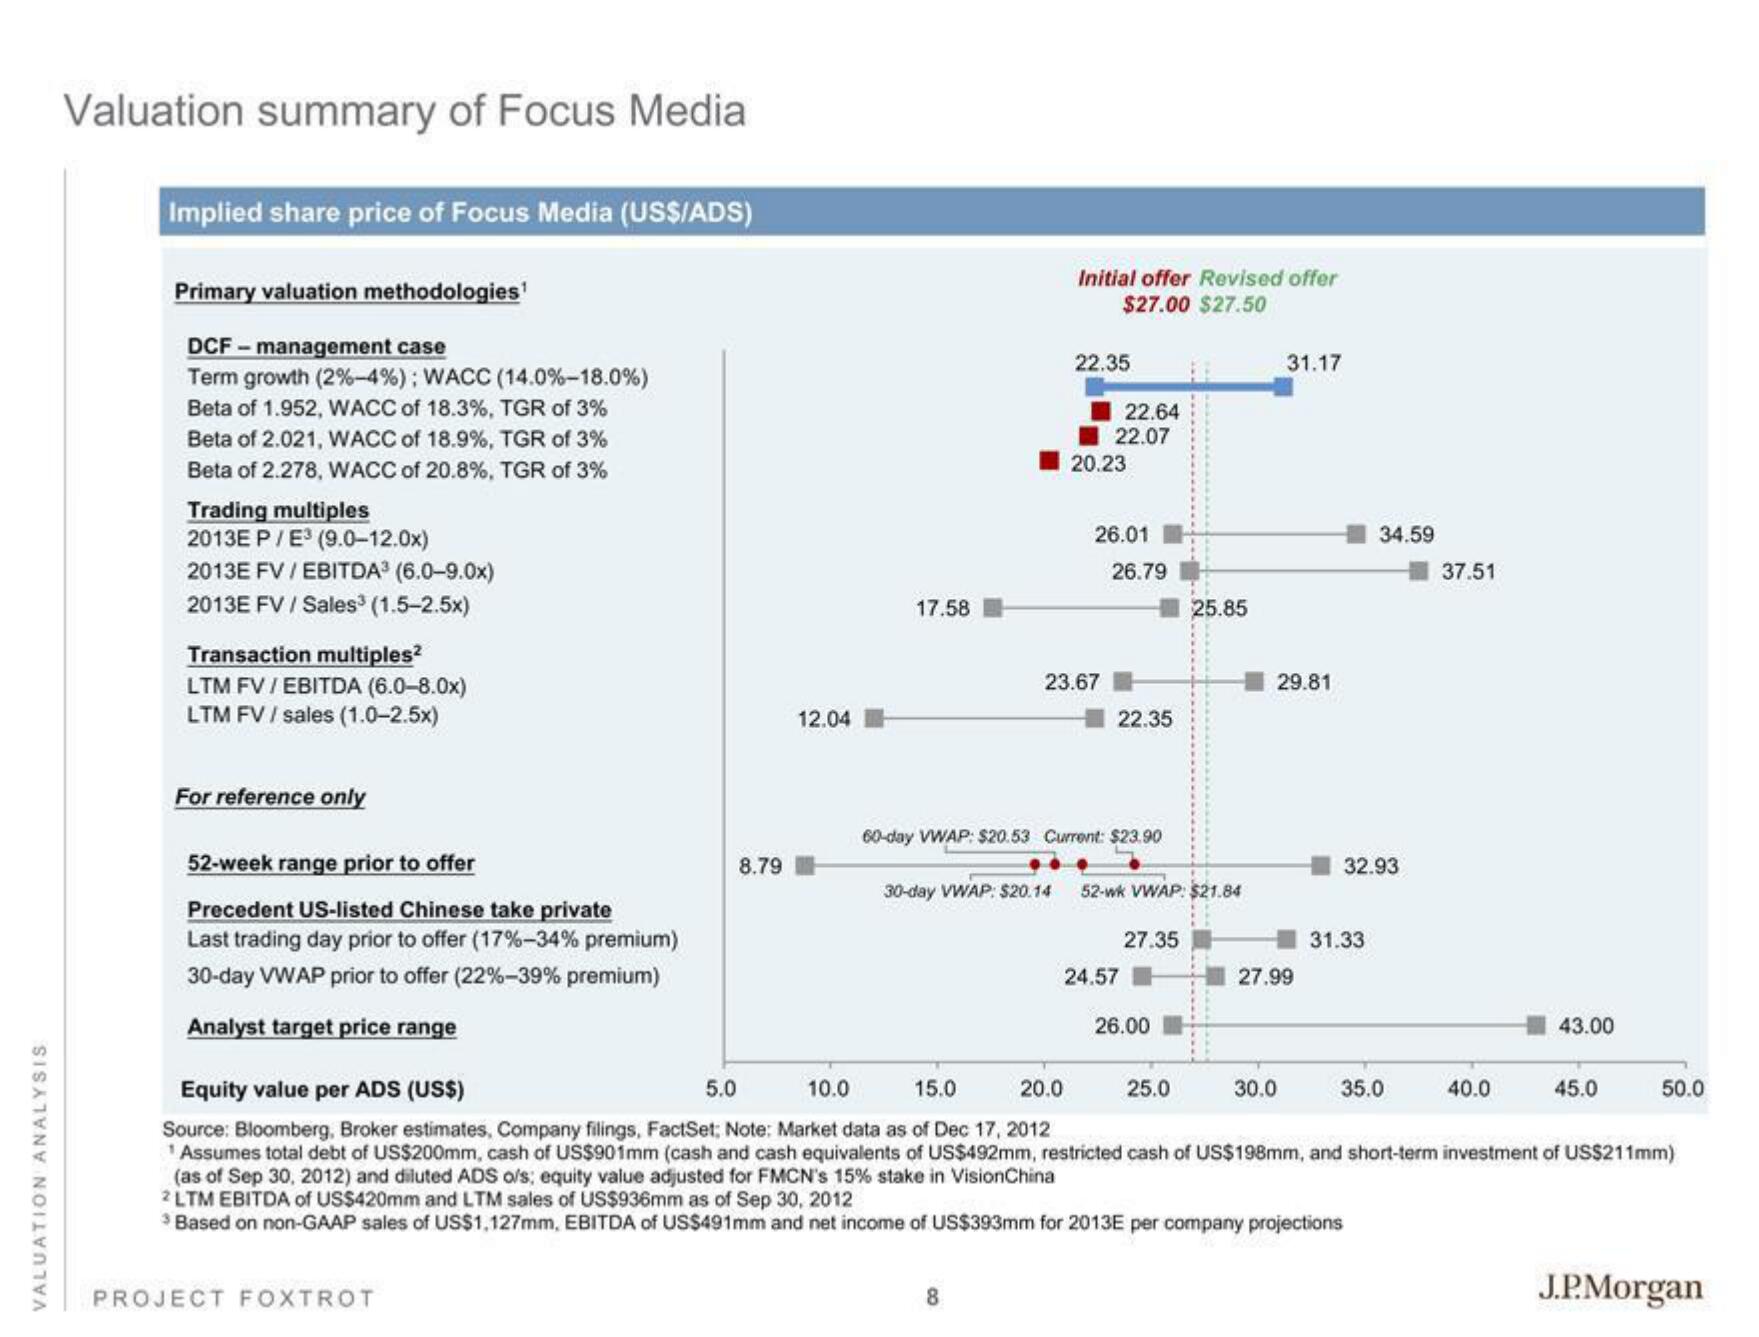
Valuation summary of Focus Media
Implied share price of Focus Media (US$/ADS)
Primary valuation methodologies¹
DCF-management case
Term growth (2% -4% ) : WACC (14.0 % -18.0%)
Beta of 1.952, WACC of 18.3%, TGR of 3%
Beta of 2.021, WACC of 18.9%, TGR of 3%
Beta of 2.278, WACC of 20.8%, TGR of 3%
Trading multiples
2013E P/E³ (9.0-12.0x)
2013E FV/EBITDA³ (6.0-9.0x)
2013E FV / Sales³ (1.5-2.5x)
Transaction multiples²
LTM FV/EBITDA (6.0-8.0x)
LTM FV / sales (1.0-2.5x)
For reference only
52-week range prior to offer
Precedent US-listed Chinese take private
Last trading day prior to offer ( 17% -34% premium)
30-day VWAP prior to offer (22% -39% premium)
Analyst target price range
8.79
PROJECT FOXTROT
12.04
17.58
Initial offer Revised offer
$27.00 $27.50
30-day VWAP: $20.14
22.35
8
23.67
22.64
22.07
20.23
26.01
26.79
60-day VWAP: $20.53 Current: $23.90
22.35
24.57
52-wk VWAP: $21.84
27.35
26.00
25.85
25.0
31.17
29.81
27.99
30.0
34.59
32.93
31.33
Equity value per ADS (US$)
5.0
10.0
15.0
20.0
Source: Bloomberg, Broker estimates, Company filings, FactSet; Note: Market data as of Dec 17, 2012
¹ Assumes total debt of US$200mm, cash of US$901mm (cash and cash equivalents of US$492mm, restricted cash of US$198mm, and short-term investment of US$211mm)
(as of Sep 30, 2012) and diluted ADS o/s; equity value adjusted for FMCN's 15% stake in Vision China
2LTM EBITDA of US$420mm and LTM sales of US$936mm as of Sep 30, 2012
³ Based on non-GAAP sales of US$1,127mm, EBITDA of US$491mm and net income of US$393mm for 2013E per company projections
37.51
35.0
43.00
40.0
45.0
50.0
J.P.MorganView entire presentation