Apollo Global Management Investor Day Presentation Deck
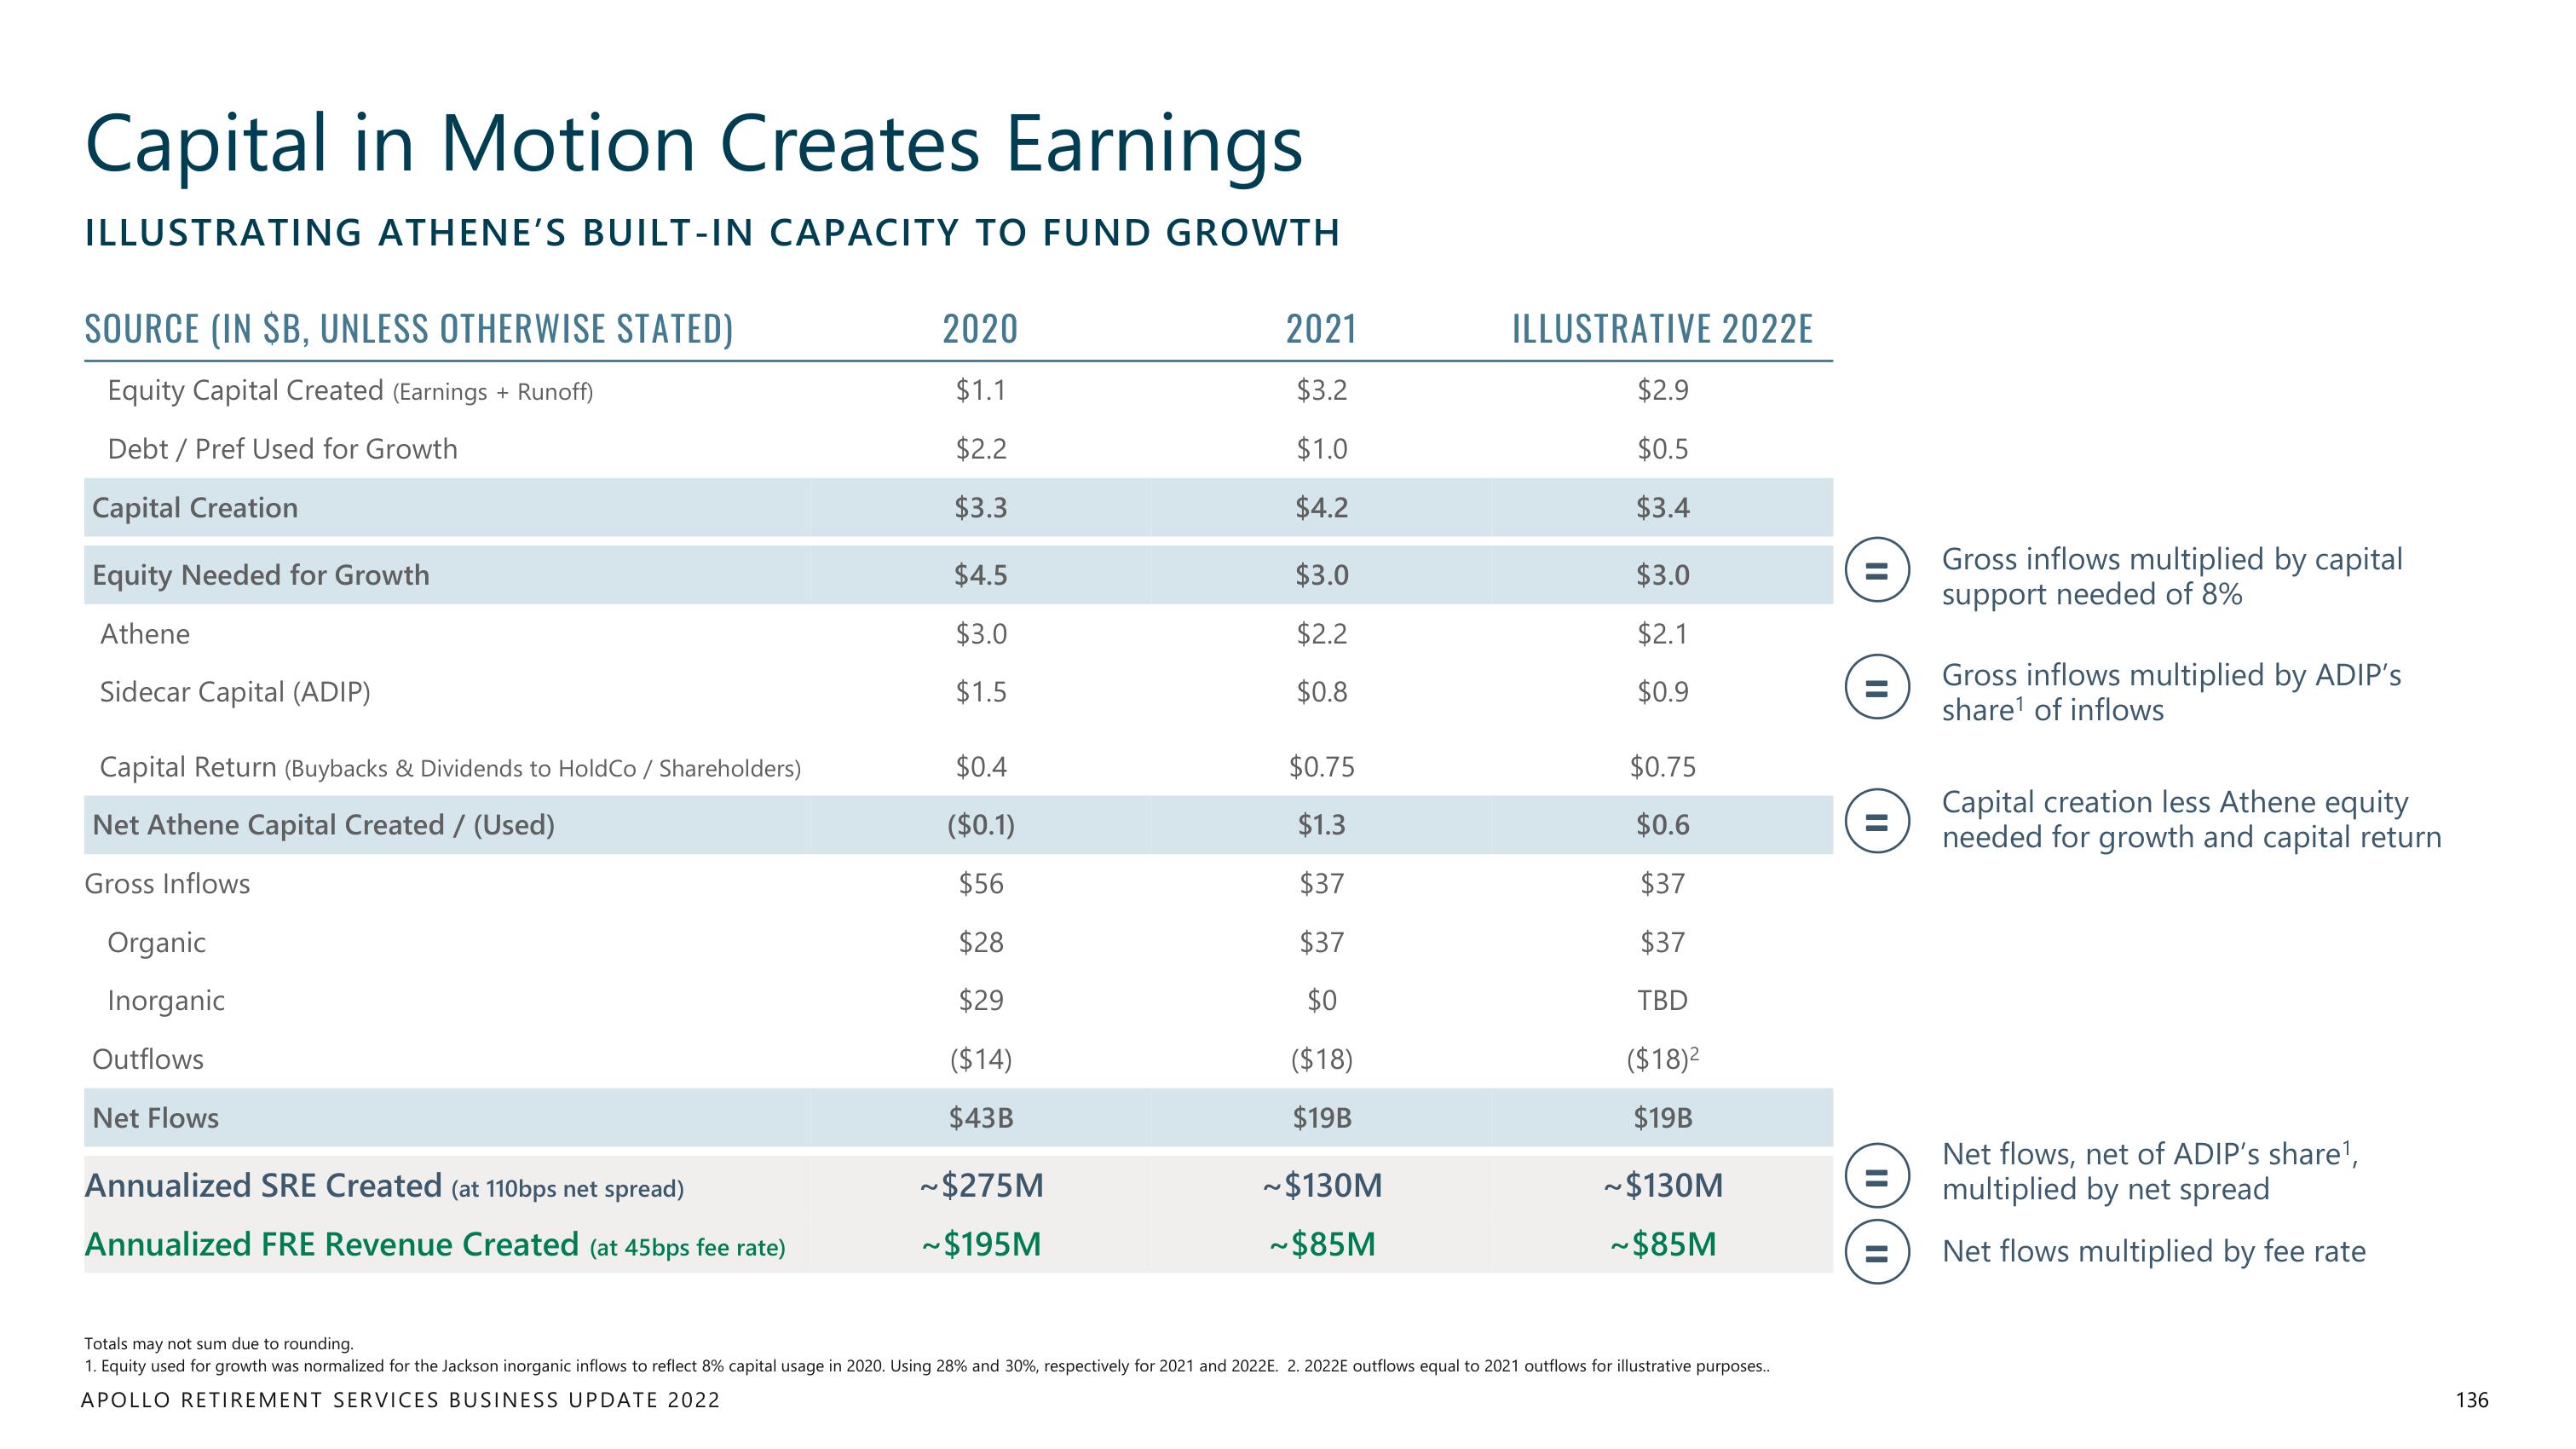
Capital in Motion Creates Earnings
ILLUSTRATING ATHENE'S BUILT-IN CAPACITY TO FUND GROWTH
SOURCE (IN $B, UNLESS OTHERWISE STATED)
Equity Capital Created (Earnings + Runoff)
Debt / Pref Used for Growth
Capital Creation
Equity Needed for Growth
Athene
Sidecar Capital (ADIP)
Capital Return (Buybacks & Dividends to HoldCo/ Shareholders)
Net Athene Capital Created / (Used)
Gross Inflows
Organic
Inorganic
Outflows
Net Flows
Annualized SRE Created (at 110bps net spread)
Annualized FRE Revenue Created (at 45bps fee rate)
2020
$1.1
$2.2
$3.3
$4.5
$3.0
$1.5
$0.4
($0.1)
$56
$28
$29
($14)
$43B
~$275M
~$195M
2021
$3.2
$1.0
$4.2
$3.0
$2.2
$0.8
$0.75
$1.3
$37
$37
$0
($18)
$19B
~$130M
~$85M
ILLUSTRATIVE 2022E
$2.9
$0.5
$3.4
$3.0
$2.1
$0.9
$0.75
$0.6
$37
$37
TBD
($18)²
$19B
~$130M
~$85M
Totals may not sum due to rounding.
1. Equity used for growth was normalized for the Jackson inorganic inflows to reflect 8% capital usage in 2020. Using 28% and 30%, respectively for 2021 and 2022E. 2. 2022E outflows equal to 2021 outflows for illustrative purposes..
APOLLO RETIREMENT SERVICES BUSINESS UPDATE 2022
||
=
Gross inflows multiplied by capital
support needed of 8%
Gross inflows multiplied by ADIP's
share¹ of inflows
Capital creation less Athene equity
needed for growth and capital return
Net flows, net of ADIP's share¹,
multiplied by net spread
Net flows multiplied by fee rate
136View entire presentation