J.P.Morgan Results Presentation Deck
Commercial Banking1
SELECTED INCOME STATEMENT DATA ($MM)
Revenue
Middle Market Banking
Corporate Client Banking
Commercial Real Estate Banking
Other
Expense
Credit costs
Net income
Average equity
ROE
Reported
$4,016
1,898
Overhead ratio
Payments revenue ($mm)
Investment Banking and Markets
revenue, gross ($mm)4
5
Average loans
Average client deposits
Allowance for loan losses
Nonaccrual loans
Net charge-off/(recovery) rate
ALL/loans
Note: Totals may not sum due to rounding
1 See note 1 on slide 13
For additional footnotes see slide 15
1,164
939
JPMORGAN CHASE & CO.
15
1,395
KEY DRIVERS / STATISTICS ($B)²
366
$1,653
Reported
$30.0
21%
35
$2,045
$924
281.0
267.8
5.0
0.8
0.18%
1.80
4Q23
FR impact
$361
75
2
284
4Q23
27
97
$180
FR impact
$1.5
1%
(3)
$65
39.0
5.7
0.7
0.1
(0.03) %
(0.01)
7
ex. FR
$3,655
1,823
1,162
655
15
1,368
269
$1,473
ex. FR
$28.5
20%
37
$1,980
$924
242.0
262.1
4.3
0.7
0.21%
1.81
ex. FR $ 0/(U)
3Q23
($10)
40
(46)
7
(11)
11
205
($217)
ex. FR
3Q23
$28.5
23%
37
$2,045
$821
244.0
262.1
4.2
0.9
0.08%
1.72
4Q22
$251
204
53
(11)
5
114
(15)
$50
4Q22
$25.0
22%
37
$1,937³
$700
235.3
278.9
3.3
0.8
0.06%
1.42
CCB
CIB
CB
AWM Corp.
FINANCIAL PERFORMANCE (ex. FR)
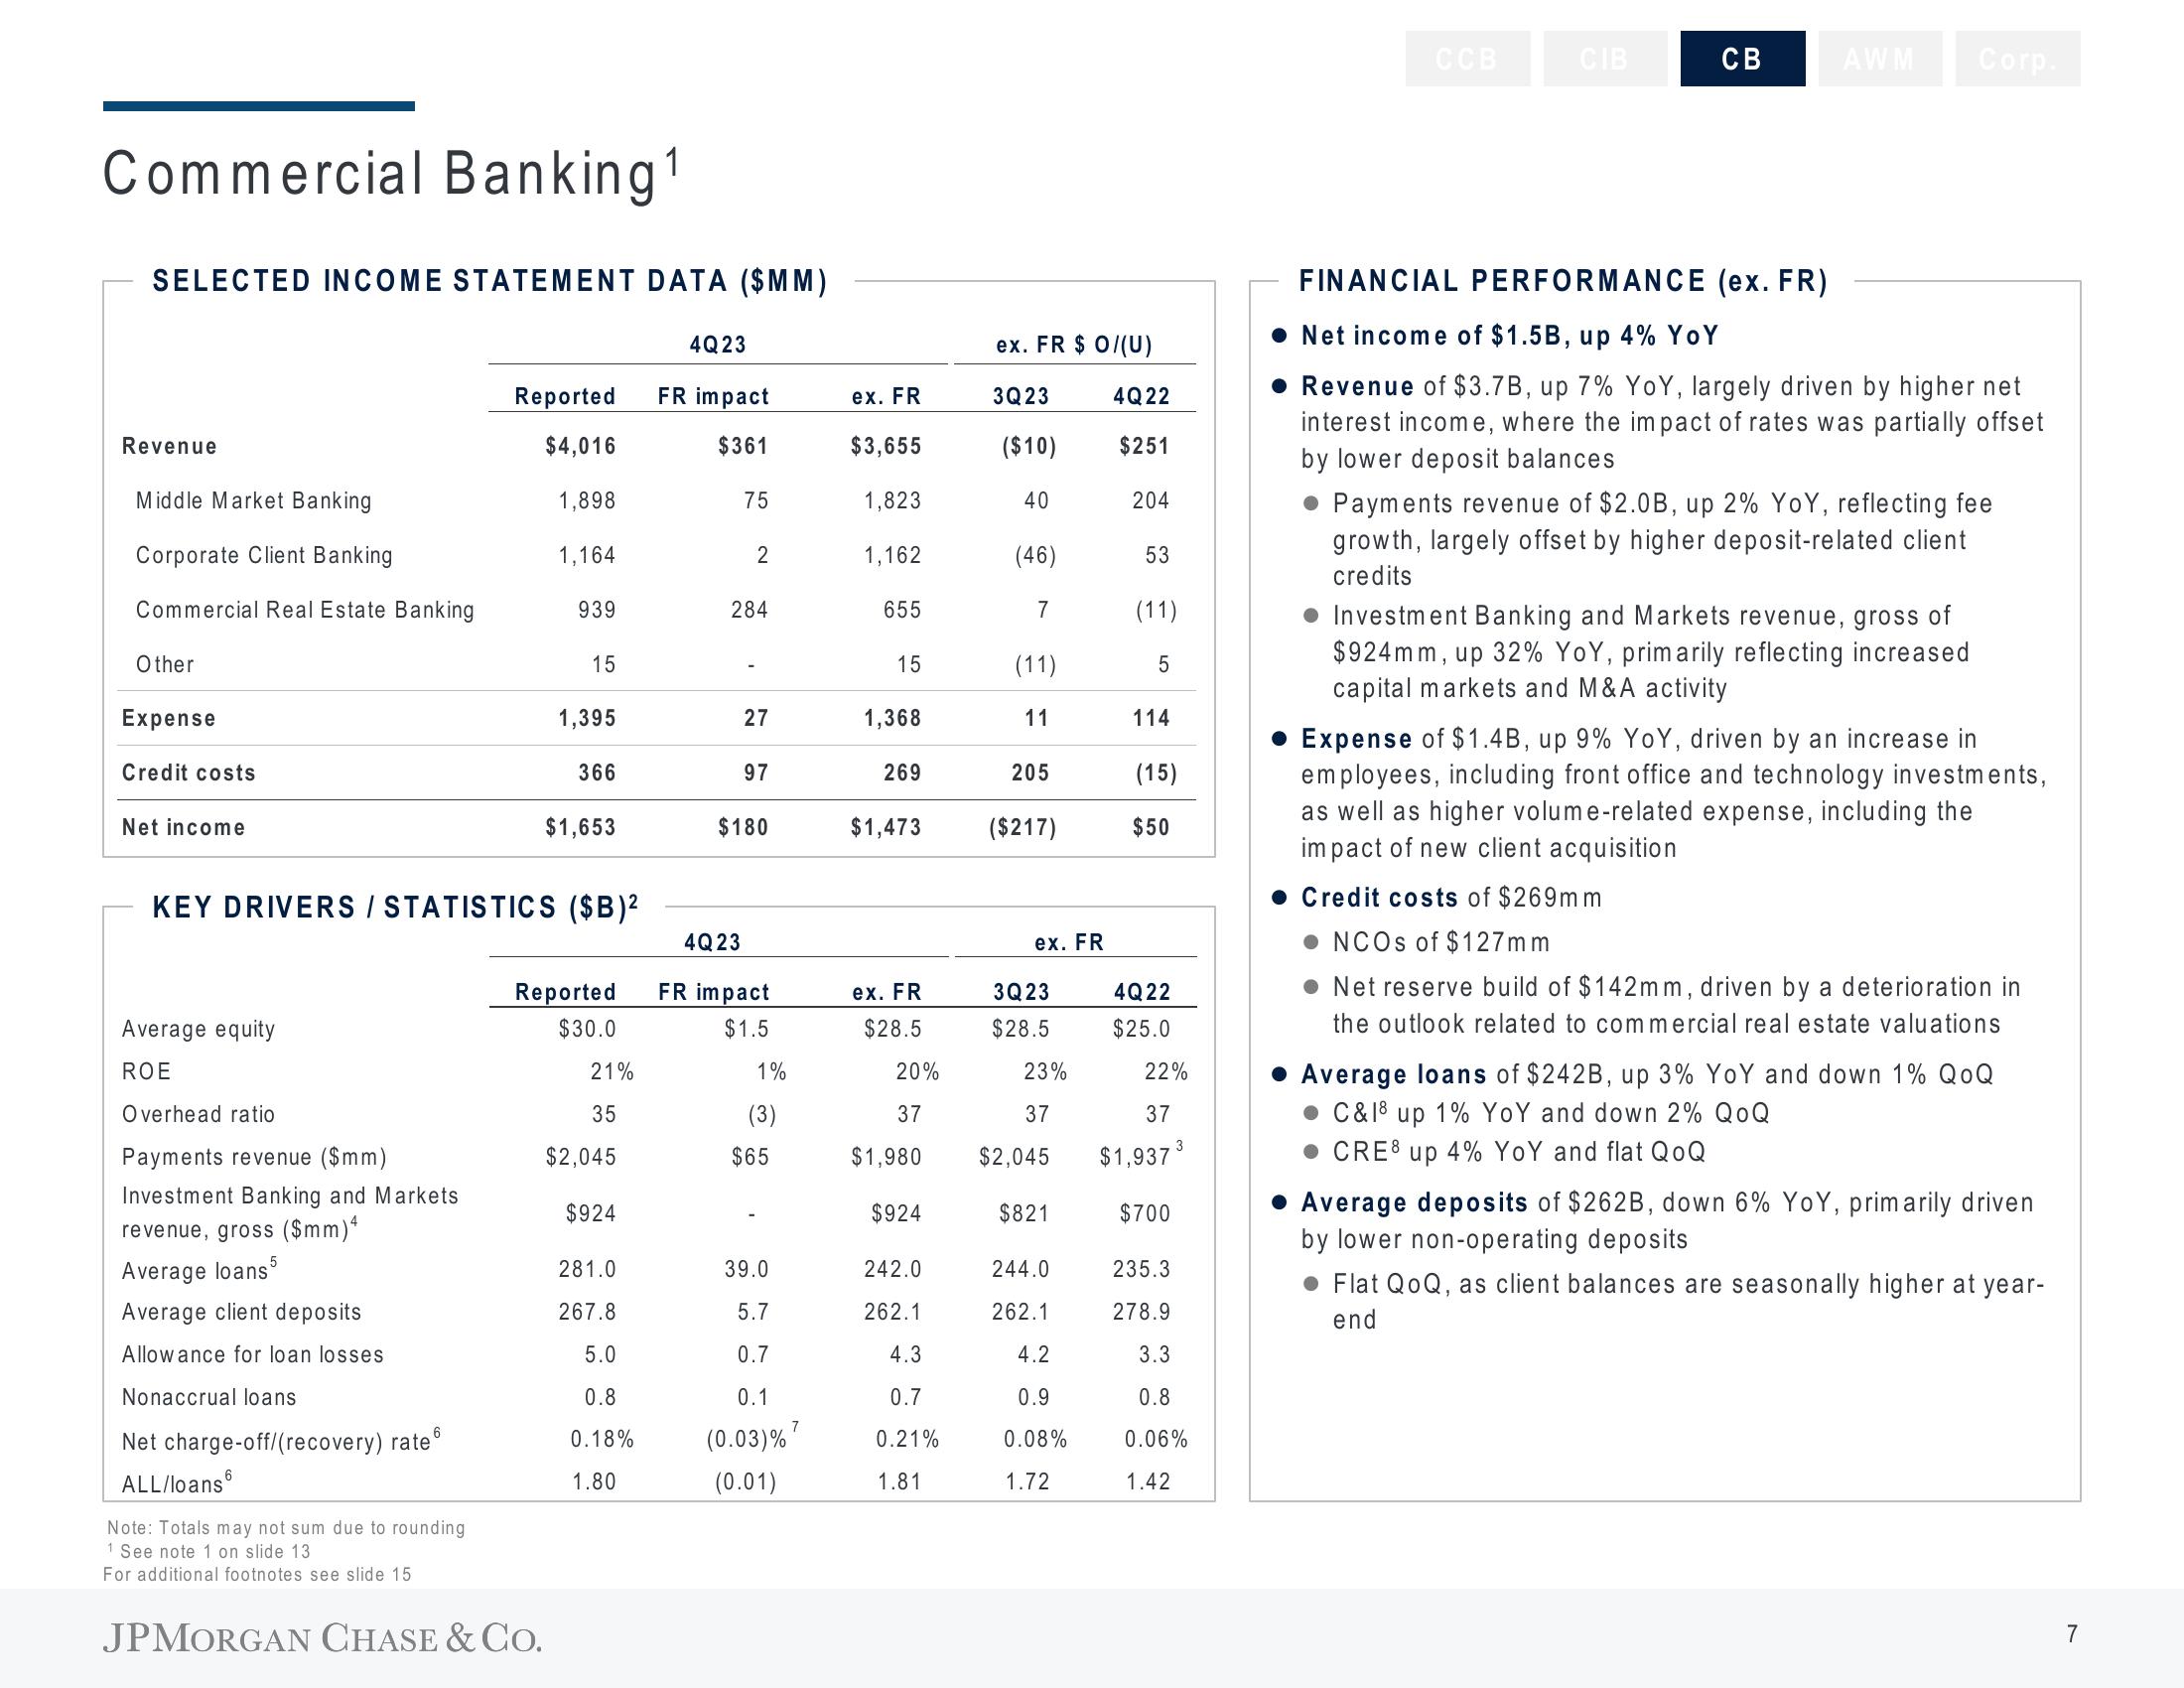
• Net income of $1.5B, up 4% YoY
Revenue of $3.7B, up 7% YoY, largely driven by higher net
interest income, where the impact of rates was partially offset
by lower deposit balances
● Payments revenue of $2.0B, up 2% YoY, reflecting fee
growth, largely offset by higher deposit-related client
credits
Investment Banking and Markets revenue, gross of
$924mm, up 32% YoY, primarily reflecting increased
capital markets and M&A activity
Expense of $1.4B, up 9% YoY, driven by an increase in
employees, including front office and technology investments,
as well as higher volume-related expense, including the
impact of new client acquisition
Credit costs of $269mm
NCOs of $127mm
.Net reserve build of $142mm, driven by a deterioration in
the outlook related to commercial real estate valuations
• Average loans of $242B, up 3% YoY and down 1% QOQ
C&18 up 1% YoY and down 2% QOQ
● CRE8 up 4% YoY and flat QoQ
• Average deposits of $262B, down 6% YoY, primarily driven
by lower non-operating deposits
Flat QoQ, as client balances are seasonally higher at year-
end
7View entire presentation