HHR Investor Presentation Deck
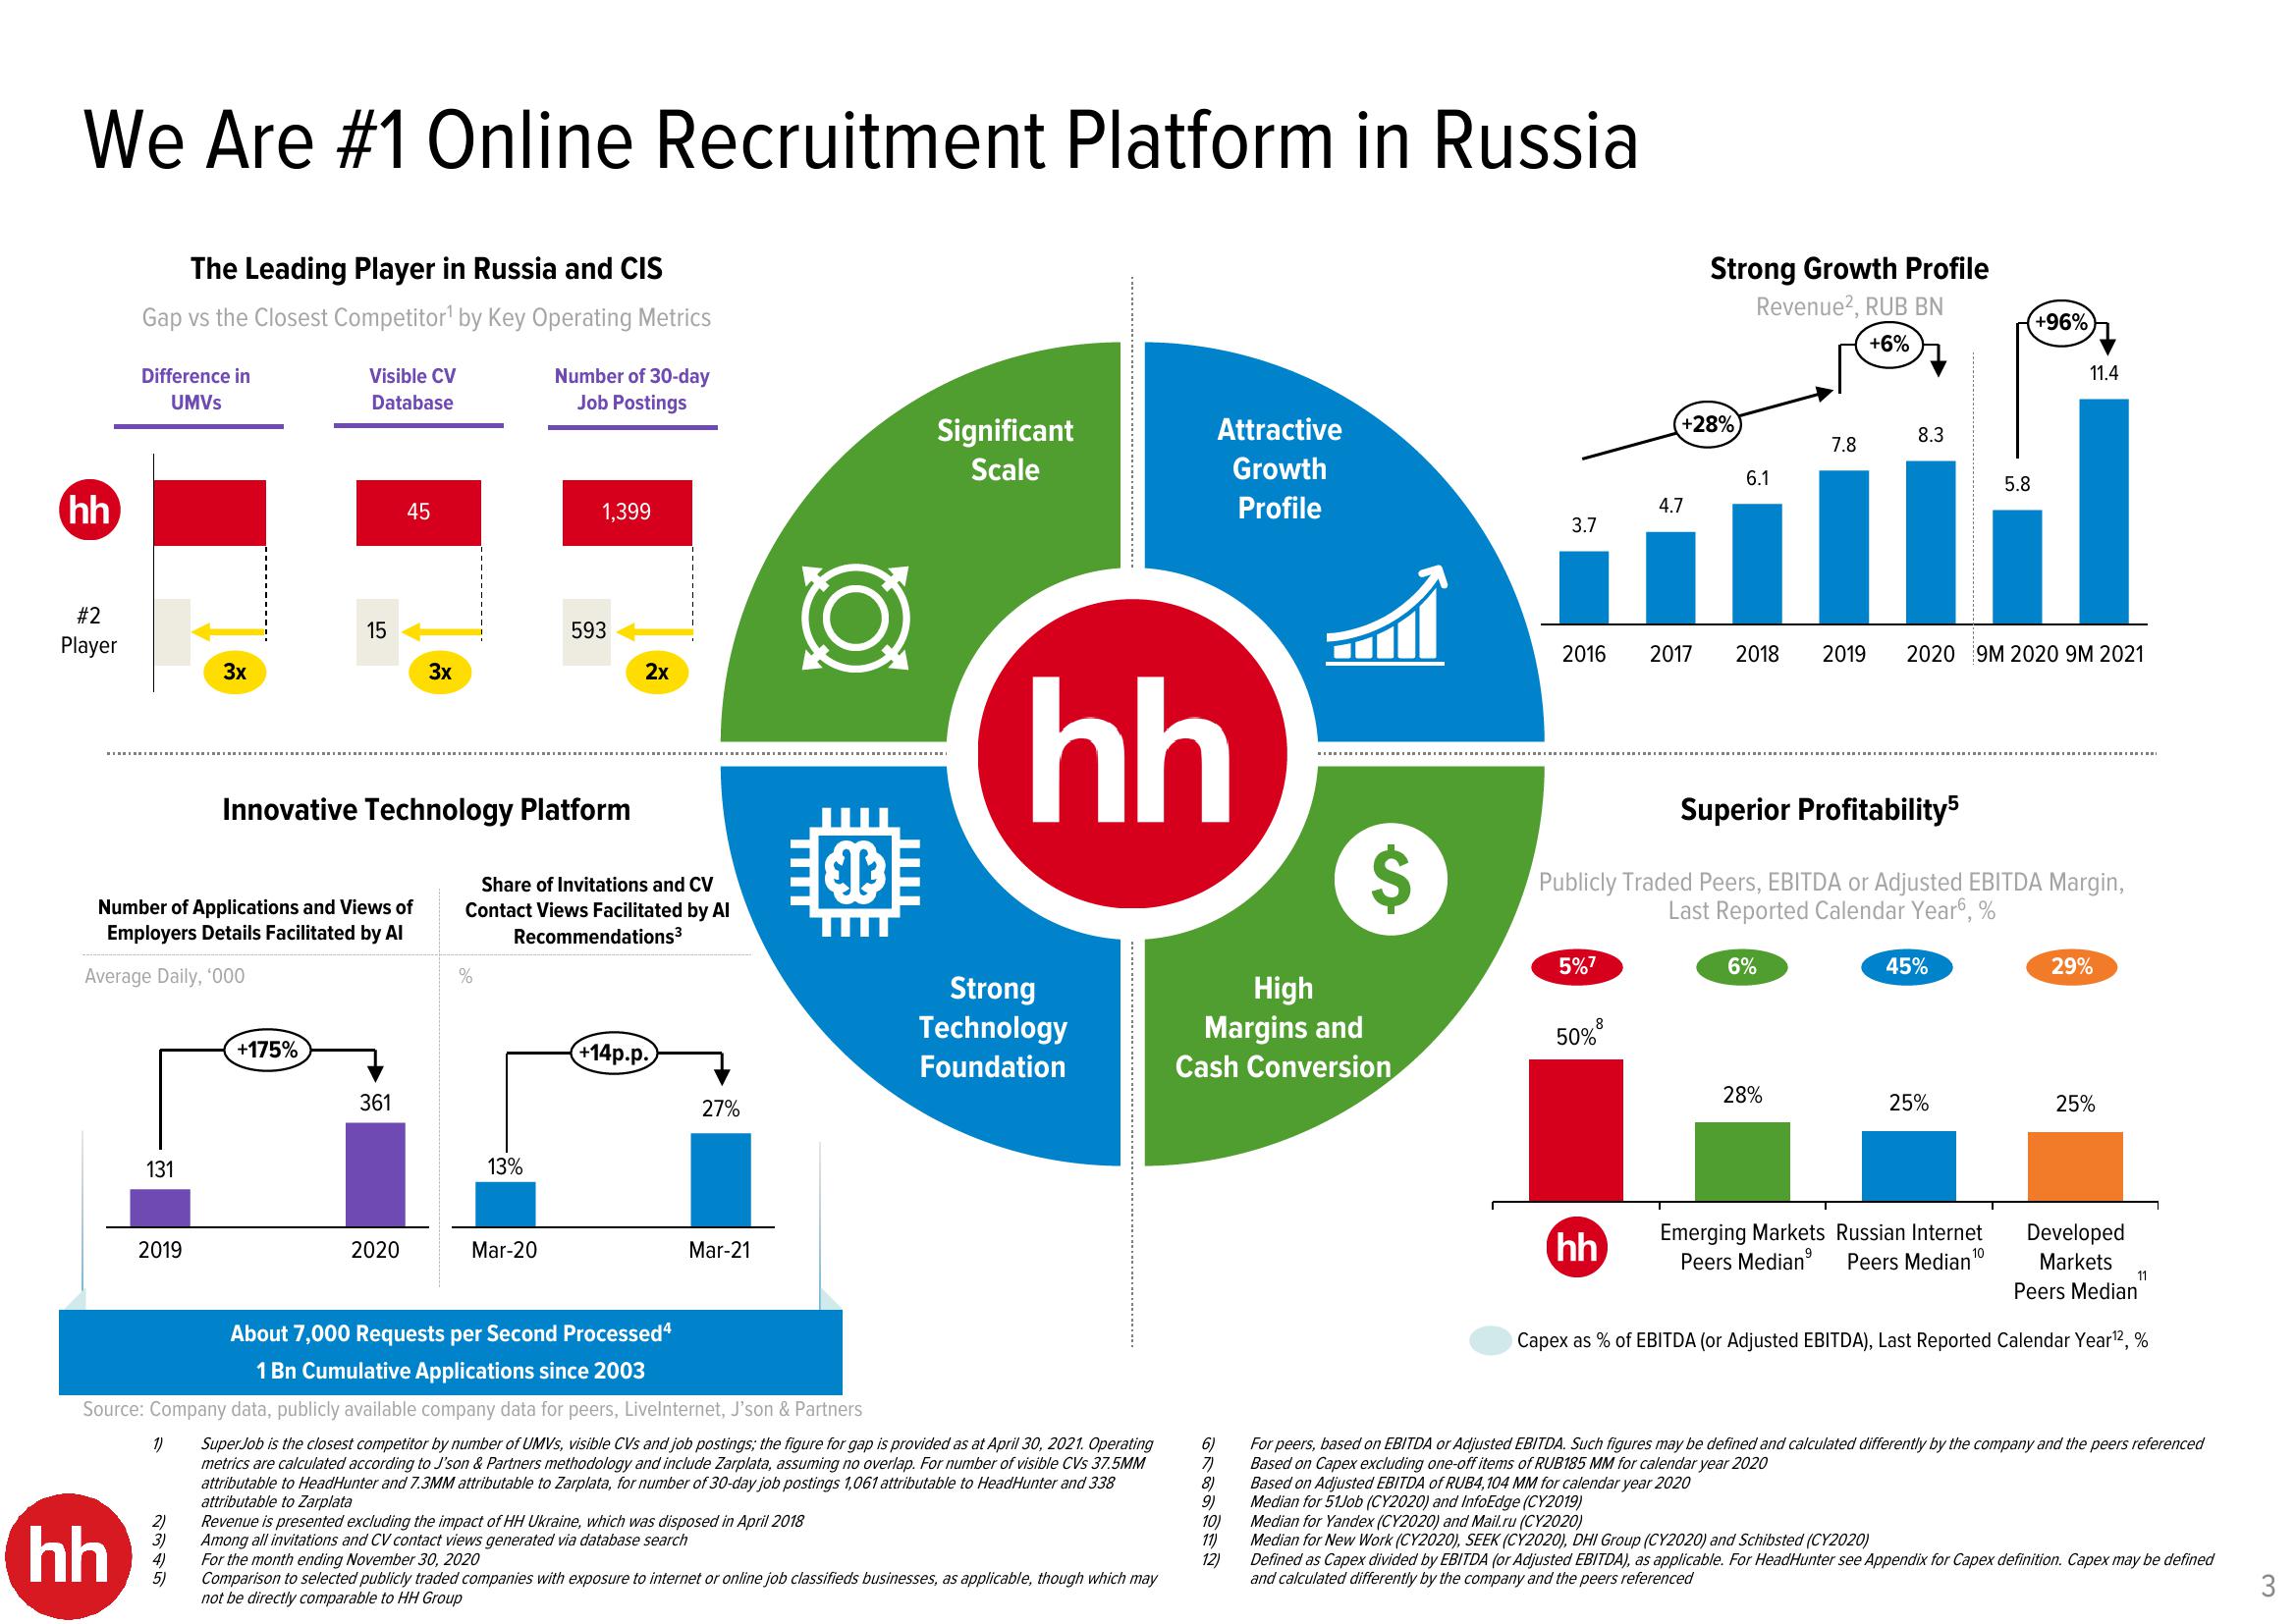
We Are #1 Online Recruitment Platform in Russia
hh
#2
Player
The Leading Player in Russia and CIS
Gap vs the Closest Competitor¹ by Key Operating Metrics
Difference in
UMVS
hh
131
2019
3x
Number of Applications and Views of
Employers Details Facilitated by Al
Average Daily, '000
1)
2)
3)
4)
5)
Visible CV
Database
15
+175%
45
361
2020
3x
Innovative Technology Platform
%
Number of 30-day
Job Postings
13%
1,399
Mar-20
593
Share of Invitations and CV
Contact Views Facilitated by Al
Recommendations³
2x
+14p.p.
27%
Mar-21
About 7,000 Requests per Second Processed4
1 Bn Cumulative Applications since 2003
Source: Company data, publicly available company data for peers, Livelnternet, J'son & Partners
O
*
Revenue is presented excluding the impact of HH Ukraine, which was disposed in April 2018
Among all invitations and CV contact views generated via database search
Significant
Scale
hh
Strong
Technology
Foundation
Super Job is the closest competitor by number of UMVs, visible CVs and job postings; the figure for gap is provided as at April 30, 2021. Operating
metrics are calculated according to J'son & Partners methodology and include Zarplata, assuming no overlap. For number of visible CVs 37.5MM
attributable to HeadHunter and 7.3MM attributable to Zarplata, for number of 30-day job postings 1,061 attributable to HeadHunter and 338
attributable to Zarplata
Attractive
Growth
Profile
For the month ending November 30, 2020
Comparison to selected publicly traded companies with exposure to internet or online job classifieds businesses, as applicable, though which may
not be directly comparable to HH Group
اس
6)
7)
8)
9)
10)
11)
12)
$
High
Margins and
Cash Conversion
3.7
5%7
8
50%
+28%
4.7
2016 2017 2018 2019
Strong Growth Profile
Revenue2, RUB BN
+6%
hh
6.1
7.8
Superior Profitability5
Publicly Traded Peers, EBITDA or Adjusted EBITDA Margin,
Last Reported Calendar Year6, %
6%
Based on Adjusted EBITDA of RUB4,104 MM for calendar year 2020
Median for 51Job (CY2020) and InfoEdge (CY2019)
Median for Yandex (CY2020) and Mail.ru (CY2020)
28%
8.3
45%
2020 9M 2020 9M 2021
25%
Emerging Markets Russian Internet
Peers Median⁹ Peers Median"
5.8
+96%
11.4
10
Developed
Markets
Peers Median
Capex as % of EBITDA (or Adjusted EBITDA), Last Reported Calendar Year ¹2, %
29%
25%
11
For peers, based on EBITDA or Adjusted EBITDA. Such figures may be defined and calculated differently by the company and the peers referenced
Based on Capex excluding one-off items of RUB185 MM for calendar year 2020
Median for New Work (CY2020), SEEK (CY2020), DHI Group (CY2020) and Schibsted (CY2020)
Defined as Capex divided by EBITDA (or Adjusted EBITDA), as applicable. For HeadHunter see Appendix for Capex definition. Capex may be defined
and calculated differently by the company and the peers referenced
3View entire presentation