LCI Industries Investor Presentation Deck slide image

LCI Industries Investor Presentation Deck

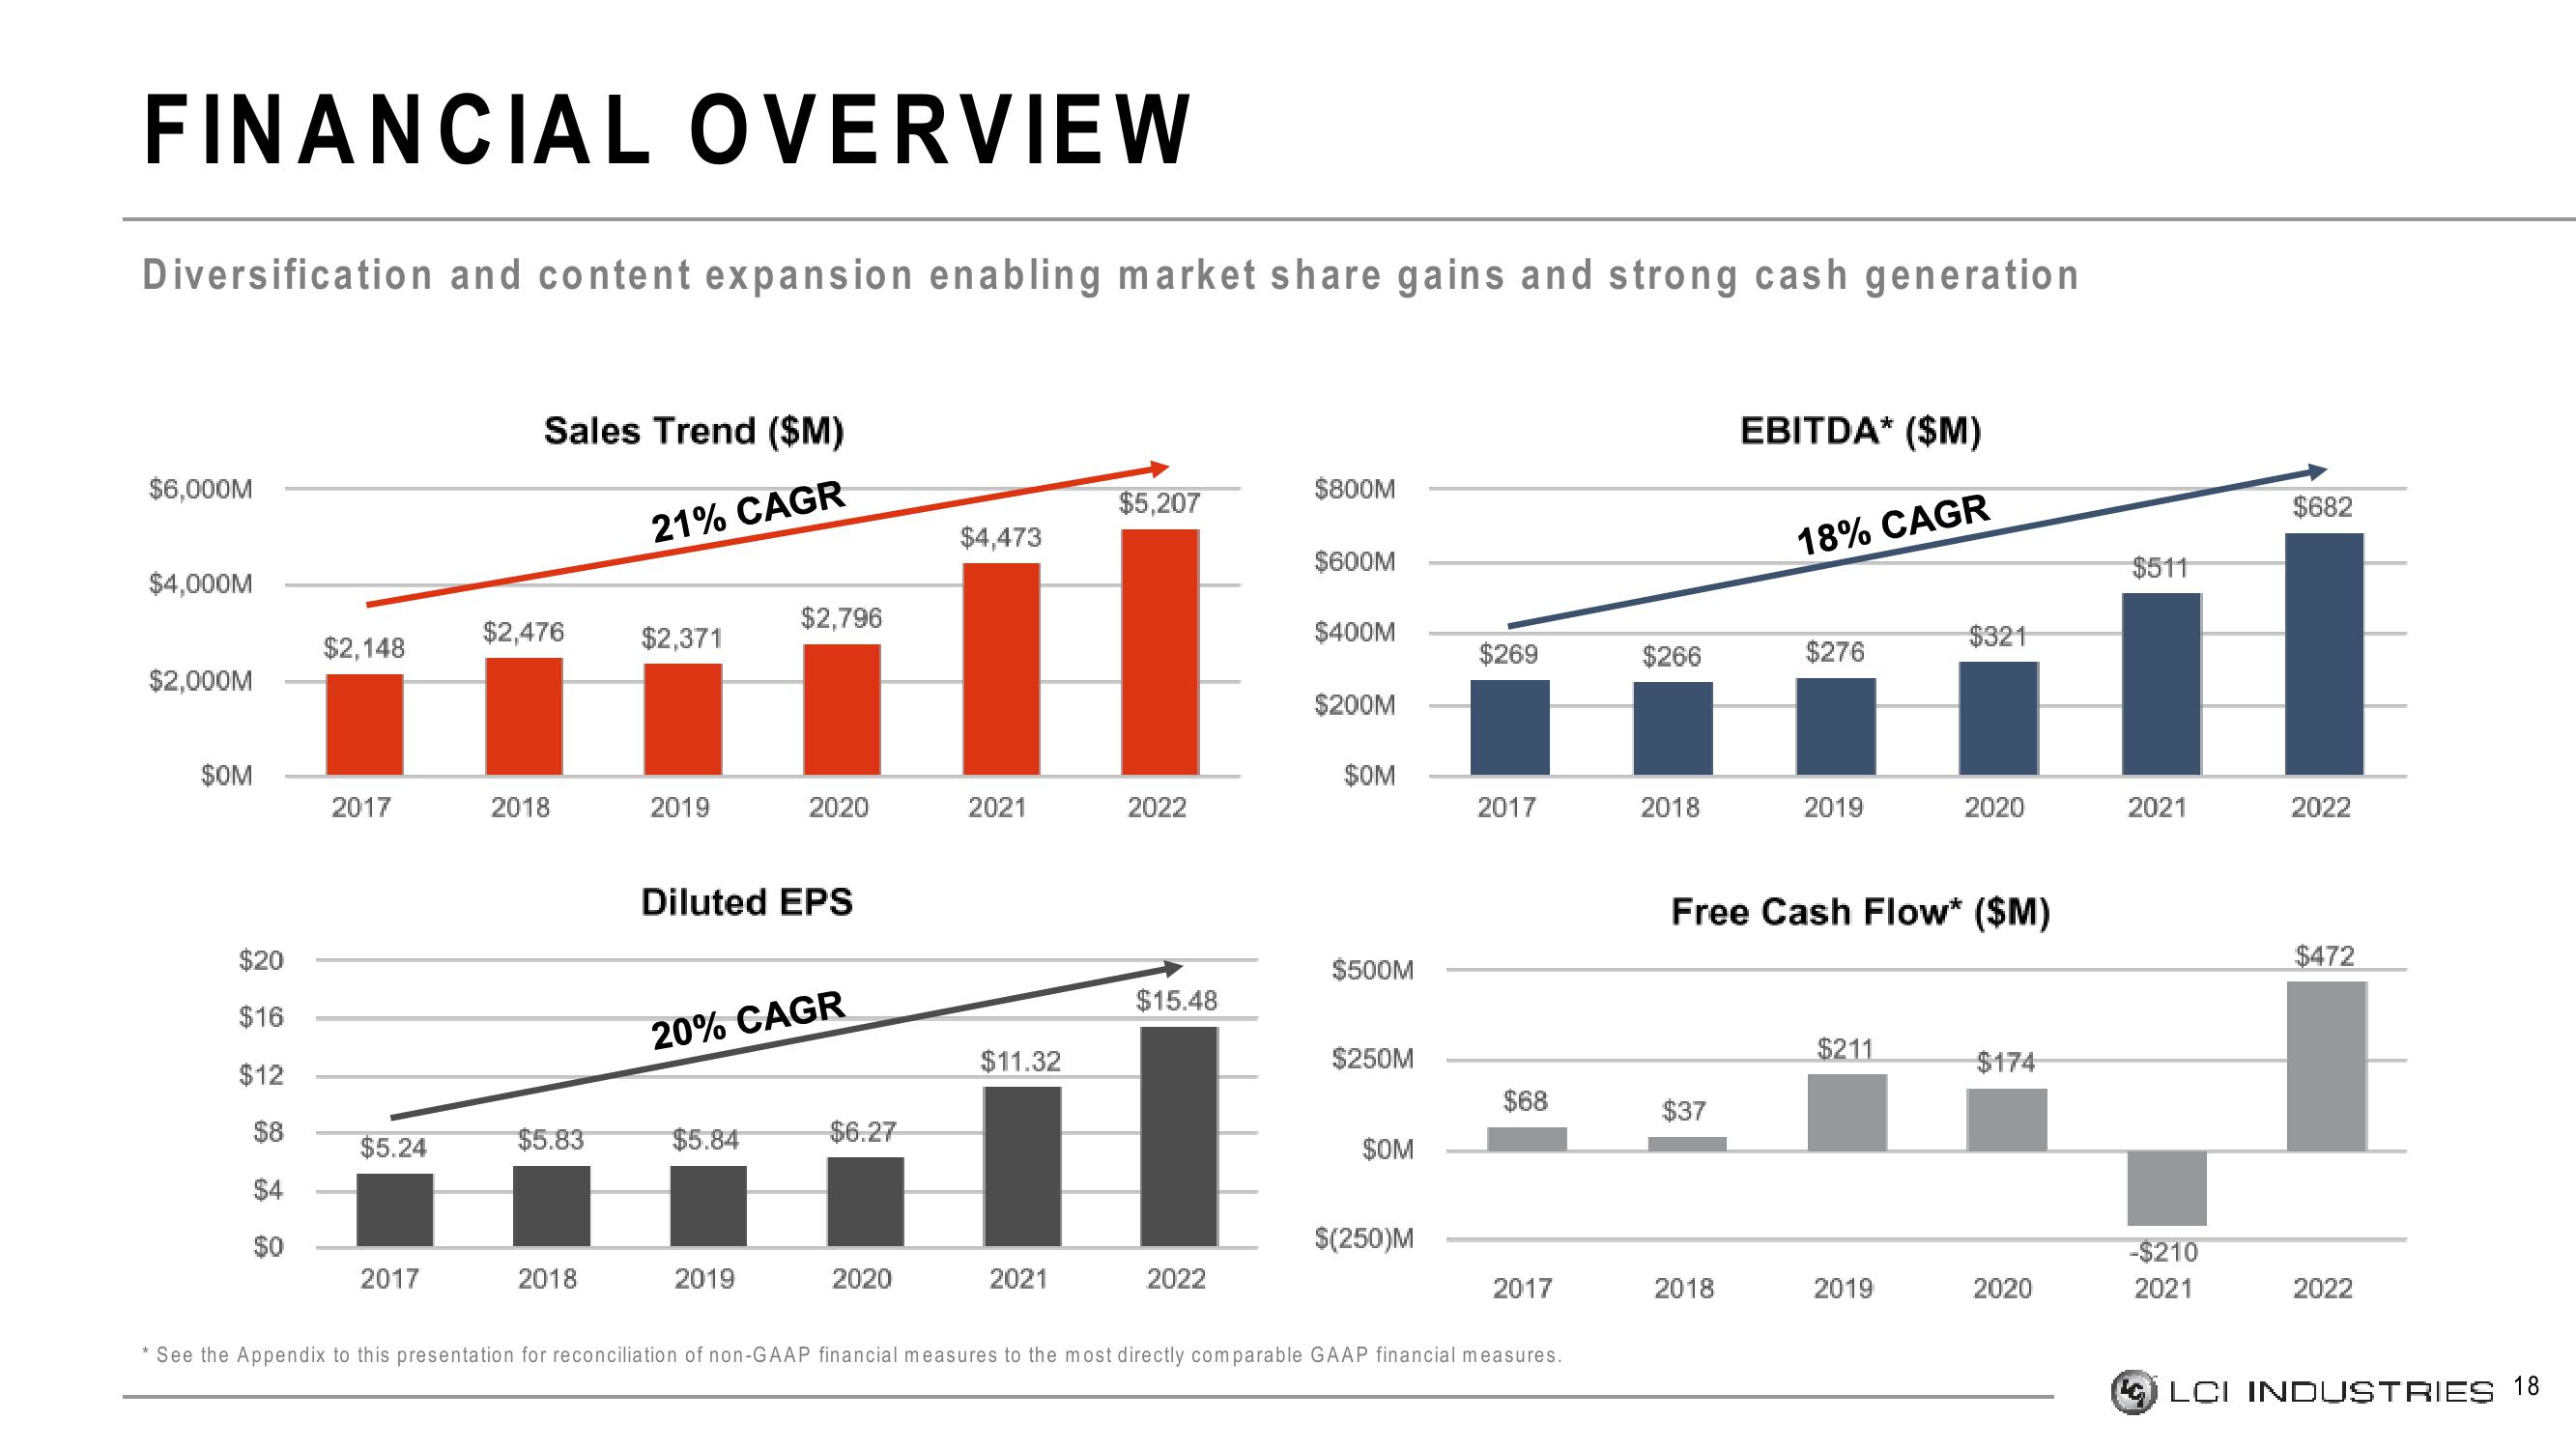
FINANCIAL OVERVIEW Diversification and content expansion enabling market share gains and strong cash generation $6,000M $4,000M $2,000M $OM $20 $16 $12 $8 $4 $0 $2,148 2017 $5.24 2017 Sales Trend ($M) 21% CAGR $2,476 2018 $5.83 2018 $2,371 2019 $2,796 Diluted EPS $5.84 2020 20% CAGR 2019 $6.27 2020 $4,473 2021 $11.32 2021 $5,207 2022 $15.48 2022 $800M $600M $400M $200M $OM $500M $250M $OM $(250)M $269 2017 $68 2017 * See the Appendix to this presentation for reconciliation of non-GAAP financial measures to the most directly comparable GAAP financial measures. $266 2018 $37 EBITDA* ($M) 18% CAGR 2018 $276 2019 Free Cash Flow* ($M) $211 $321 2019 2020 $174 2020 $511 2021 -$210 2021 $682 2022 $472 2022 LCI INDUSTRIES 18
View entire presentation