Bank of America Investment Banking Pitch Book
Preliminary Valuation Considerations
Preliminary Discounted Cash Flow Analysis
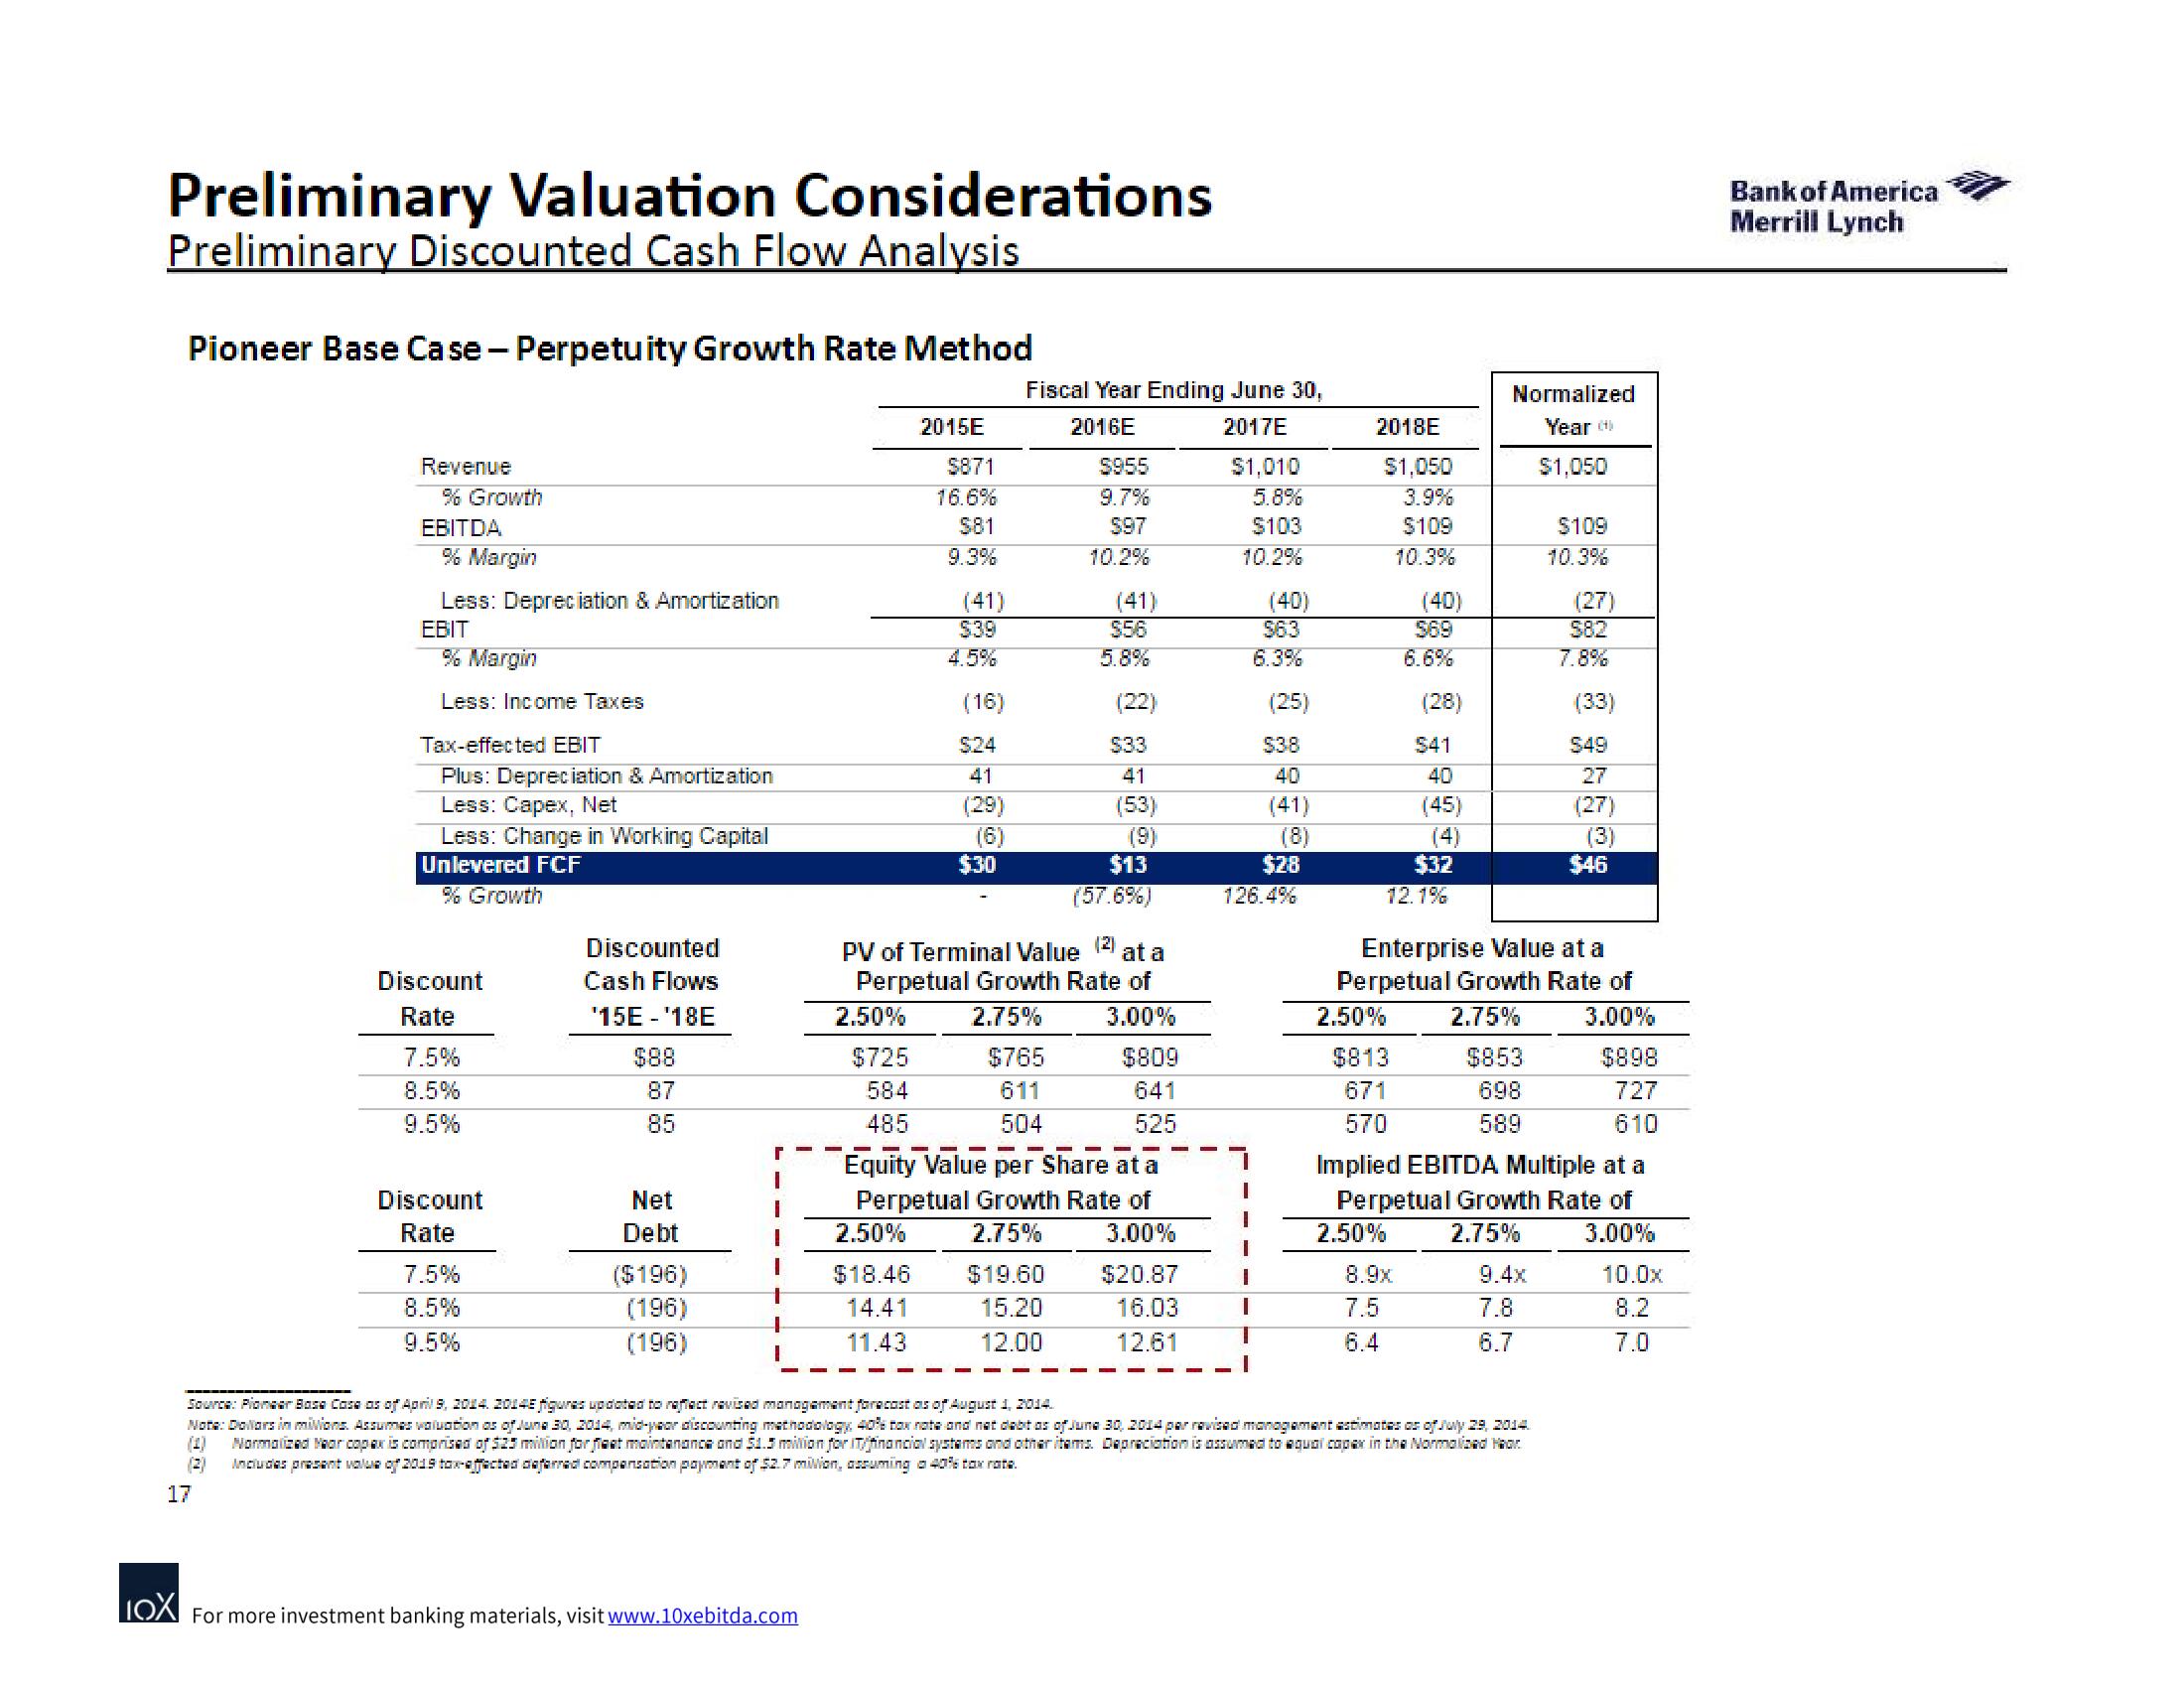
Pioneer Base Case - Perpetuity Growth Rate Method
Revenue
% Growth
EBITDA
% Margin
Less: Depreciation & Amortization
EBIT
% Margin
Less: Income Taxes
Tax-effected EBIT
Plus: Depreciation & Amortization
Less: Capex, Net
Less: Change in Working Capital
Unlevered FCF
% Growth
Discount
Rate
7.5%
8.5%
9.5%
Discount
Rate
7.5%
8.5%
9.5%
Discounted
Cash Flows
'15E - ¹18E
$88
87
85
Net
Debt
($196)
(196)
(196)
↓
I
IOX For more investment banking materials, visit www.10xebitda.com
2.50%
$725
584
485
2015E
$871
16.6%
581
9.3%
$18.46
14.41
11.43
(41)
$39
4.5%
(16)
$24
41
(29)
(6)
$30
Fiscal Year Ending June 30,
2016E
2017E
$1,010
5.8%
$103
10.2%
$955
9.7%
$97
10.2%
$765
611
504
(41)
$56
5.8%
(2)
PV of Terminal Value
at a
Perpetual Growth Rate of
2.75%
3.00%
(22)
$33
41
(53)
19
$13
(57.6%)
$809
641
525
Equity Value per Share at a
Perpetual Growth Rate of
2.50% 2.75% 3.00%
$19.60
$20.87
15.20
16.03
12.00
12.61
(40)
$63
6.3%
(25)
I
I
T
I
$38
40
(41)
(8)
$28
126.4%
2018E
$1,050
3.9%
$109
10.3%
(40)
2.50%
$813
671
570
569
6.6%
(28)
8.9x
7.5
6.4
541
40
(45)
(4)
12.1%
$32
Normalized
Year
$1,050
$853
698
589
Enterprise Value at a
Perpetual Growth Rate of
2.75%
3.00%
9.4x
87
7.8
$109
10.3%
6.7
Source: Pioneer Bose Cose as of April 9, 2014. 20145 figures updated to reflect revised management forecast as of August 1, 2014.
Note: Dollars in milions. Assumes valuation as of June 30, 2014, mid-year discounting methodology, 40% tax rate and nat debt as of June 30, 2014 par revised management estimates or of July 29, 2014.
(1) Normalized Year copax is comprised of $23 million for fleet maintenance and 51.3 million for IT/financial systems and other itams. Depreciation is assumed to qualcopex in the Normalized Hear
(3) Includes present value of 2019 tax-affected deferred compensation payment of $2.7 million, assuming a 40% tax rate.
17
(27)
Implied EBITDA Multiple at a
Perpetual Growth Rate of
2.50% 2.75%
3.00%
$82
7.8%
(33)
$49
27
(27)
(3)
$46
$898
727
610
10.0x
8.2
7.0
Bank of America
Merrill LynchView entire presentation