Bank of America Investment Banking Pitch Book
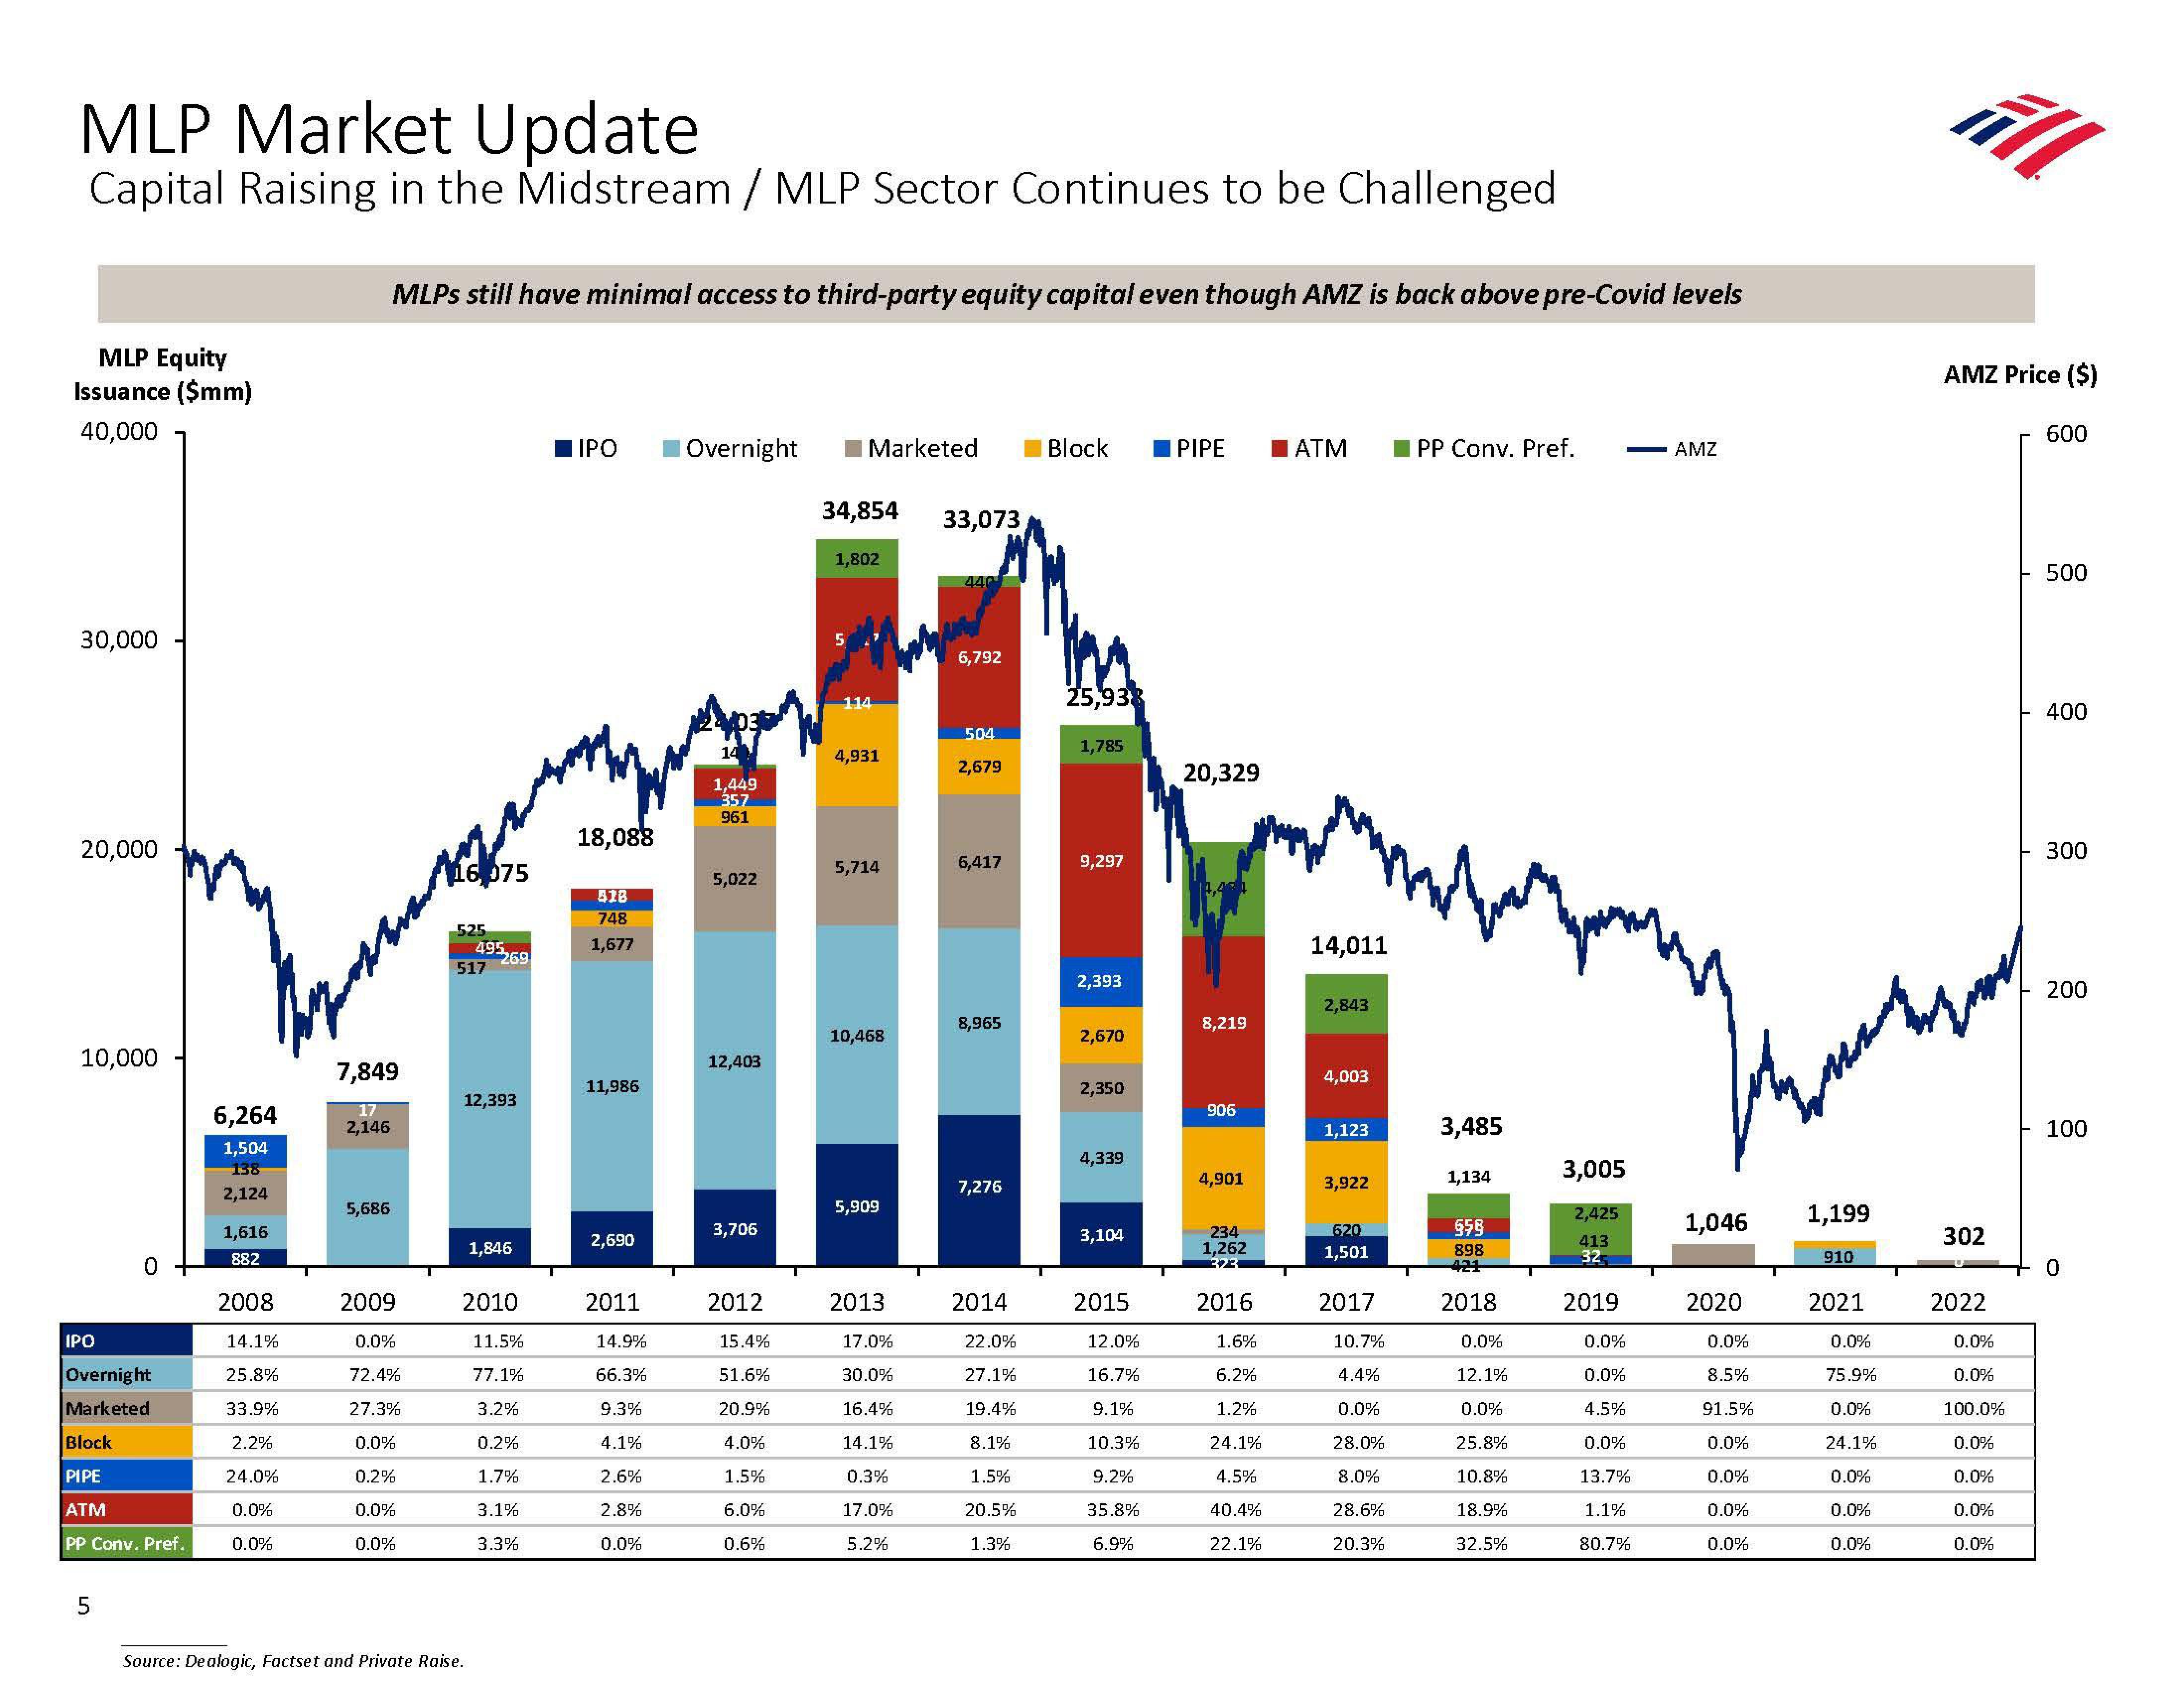
MLP Market Update
Capital Raising in the Midstream / MLP Sector Continues to be Challenged
MLP Equity
Issuance ($mm)
40,000
30,000
20,000
10,000
IPO
0
Overnight
Marketed
Block
PIPE
ATM
PP Conv. Pref.
5
6,264
1,504
138
2,124
1,616
882
2008
14.1%
25.8%
33.9%
2.2%
24.0%
0.0%
0.0%
MLPs still have minimal access to third-party equity capital even though AMZ is back above pre-Covid levels
7,849
17
2,146
5,686
2009
0.0%
72.4%
27.3%
0.0%
0.2%
0.0%
0.0%
16, 075
525
495
517
269
12,393
Source: Dealogic, Factset and Private Raise.
1,846
2010
11.5%
77.1%
3.2%
0.2%
1.7%
3.1%
3.3%
IPO
18,088
418
748
1,677
11,986
2,690
2011
14.9%
66.3%
9.3%
4.1%
2.6%
2.8%
0.0%
Overnight
1,449
357
961
5,022
12,403
3,706
2012
15.4%
51.6%
20.9%
4.0%
1.5%
6.0%
0.6%
Marketed
34,854 33,073
1,802
114
4,931
5,714
10,468
5,909
2013
17.0%
30.0%
16.4%
14.1%
0.3%
17.0%
5.2%
440
6,792
504
2,679
6,417
8,965
7,276
2014
22.0%
27.1%
19.4%
8.1%
1.5%
20.5%
1.3%
Block
25,938
1,785
9,297
2,393
2,670
2,350
4,339
3,104
2015
12.0%
16.7%
9.1%
10.3%
9.2%
35.8%
6.9%
PIPE
20,329
8,219
906
4,901
234
1,262
323
2016
1.6%
6.2%
1.2%
24.1%
4.5%
40.4%
22.1%
ATM
14,011
2,843
4,003
1,123
3,922
620
1,501
2017
10.7%
4.4%
0.0%
28.0%
8.0%
28.6%
20.3%
PP Conv. Pref. - AMZ
3,485
1,134
658
898
421
2018
0.0%
12.1%
0.0%
25.8%
10.8%
18.9%
32.5%
3,005
2,425
413
32
2019
0.0%
0.0%
4.5%
0.0%
13.7%
1.1%
80.7%
Marnateg
1,046
2020
0.0%
8.5%
91.5%
0.0%
0.0%
0.0%
0.0%
1,199
910
2021
AMZ Price ($)
0.0%
75.9%
0.0%
24.1%
0.0%
0.0%
0.0%
302
2022
0.0%
0.0%
100.0%
0.0%
0.0%
0.0%
0.0%
600
500
400
300
200
100View entire presentation