Maersk Results Presentation Deck
A.P. Moller Maersk Group
- Interim Report 02 2015
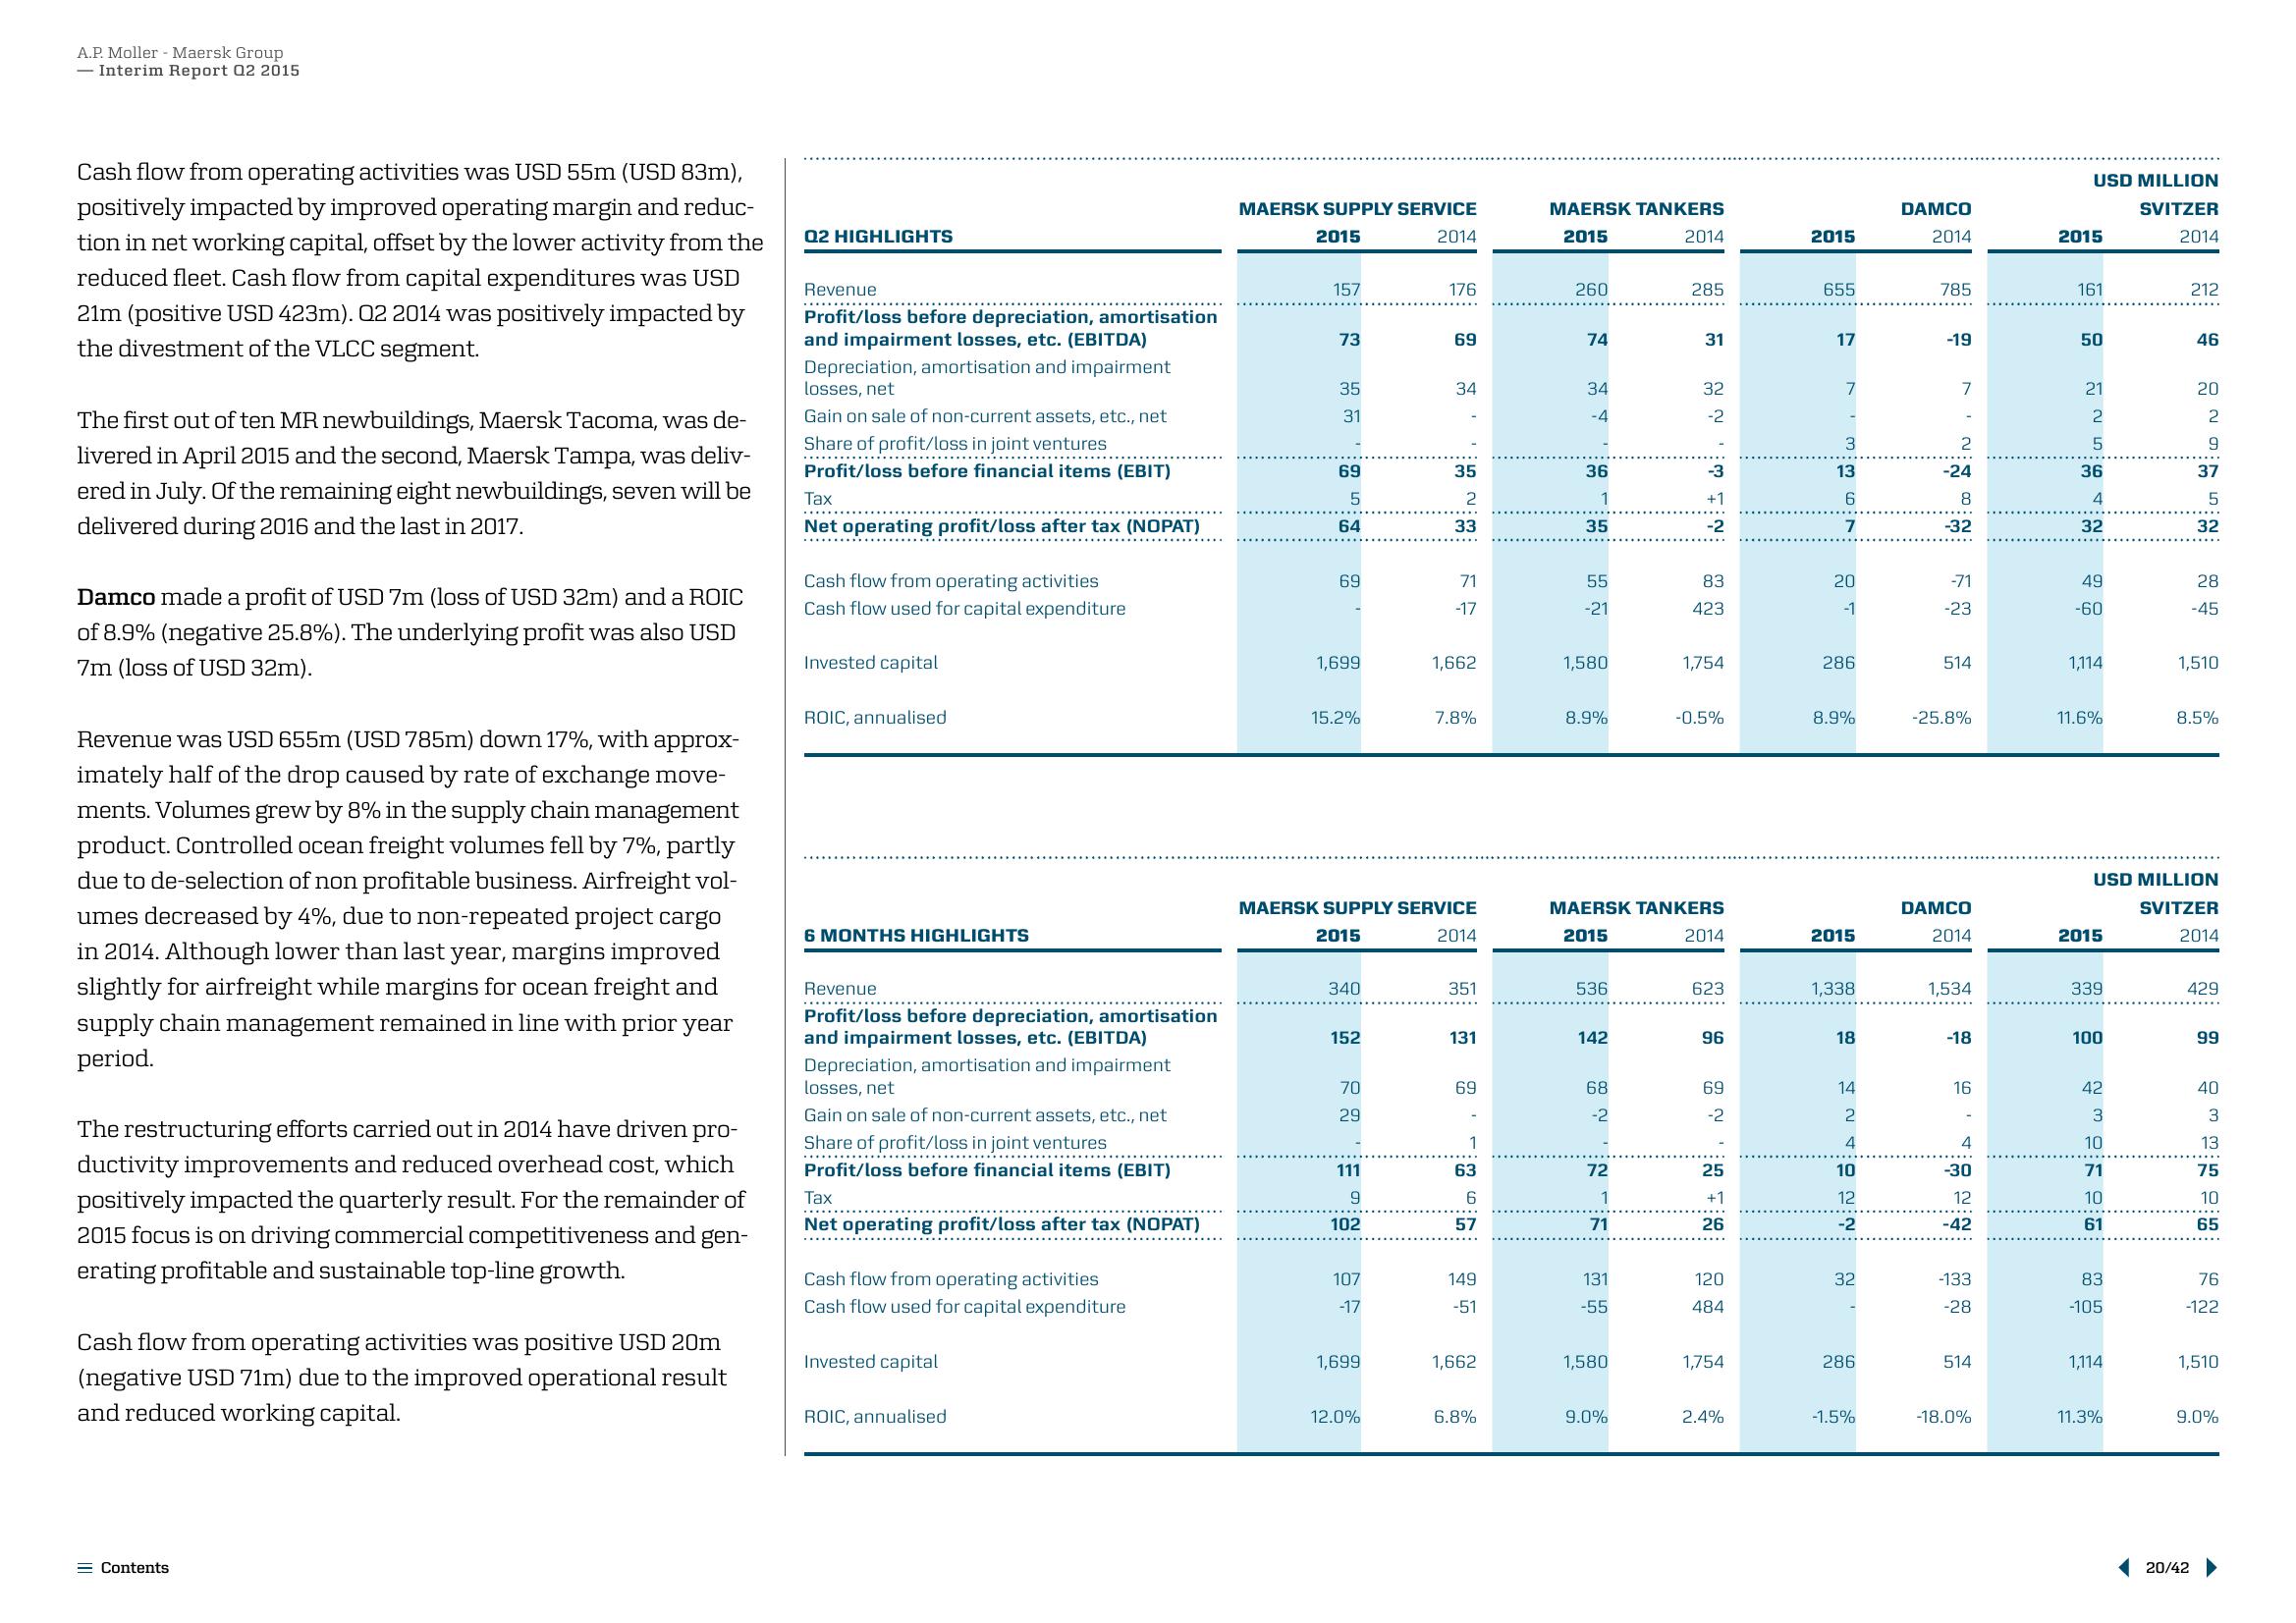
Cash flow from operating activities was USD 55m (USD 83m),
positively impacted by improved operating margin and reduc-
tion in net working capital, offset by the lower activity from the
reduced fleet. Cash flow from capital expenditures was USD
21m (positive USD 423m). 02 2014 was positively impacted by
the divestment of the VLCC segment.
The first out of ten MR newbuildings, Maersk Tacoma, was de-
livered in April 2015 and the second, Maersk Tampa, was deliv-
ered in July. Of the remaining eight newbuildings, seven will be
delivered during 2016 and the last in 2017.
Damco made a profit of USD 7m (loss of USD 32m) and a ROIC
of 8.9% (negative 25.8%). The underlying profit was also USD
7m (loss of USD 32m).
Revenue was USD 655m (USD 785m) down 17%, with approx-
imately half of the drop caused by rate of exchange move-
ments. Volumes grew by 8% in the supply chain management
product. Controlled ocean freight volumes fell by 7%, partly
due to de-selection of non profitable business. Airfreight vol-
umes decreased by 4%, due to non-repeated project cargo
in 2014. Although lower than last year, margins improved
slightly for airfreight while margins for ocean freight and
supply chain management remained in line with prior year
period.
The restructuring efforts carried out in 2014 have driven pro-
ductivity improvements and reduced overhead cost, which
positively impacted the quarterly result. For the remainder of
2015 focus is on driving commercial competitiveness and gen-
erating profitable and sustainable top-line growth.
Cash flow from operating activities was positive USD 20m
(negative USD 71m) due to the improved operational result
and reduced working capital.
Contents
Q2 HIGHLIGHTS
Revenue
Profit/loss before depreciation, amortisation
and impairment losses, etc. (EBITDA)
Depreciation, amortisation and impairment
losses, net
Gain on sale of non-current assets, etc., net
Share of profit/loss in joint ventures
.………………………...
Profit/loss before financial items (EBIT)
Tax
Net operating profit/loss after tax (NOPAT)
Cash flow from operating activities
Cash flow used for capital expenditure
Invested capital
ROIC, annualised
6 MONTHS HIGHLIGHTS
Revenue
.……….….....
Profit/loss before depreciation, amortisation
and impairment losses, etc. (EBITDA)
Depreciation, amortisation and impairment
losses, net
Gain on sale of non-current assets, etc., net
Share of profit/loss in joint ventures
Profit/loss before financial items (EBIT)
*************
Tax
Net operating profit/loss after tax (NOPAT)
Cash flow from operating activities
Cash flow used for capital expenditure
Invested capital
ROIC, annualised
MAERSK SUPPLY SERVICE
2015
2014
157
73
35
31
69
5
64
69
1,699
15.2%
340
152
70
29
111
9
102
107
-17
1,699
176
MAERSK SUPPLY SERVICE
2015
2014
12.0%
69
34
35
2
33
71
-17
1,662
7.8%
351
131
69
1
63
6
57
149
-51
1,662
6.8%
MAERSK TANKERS
2015
2014
260
74
34
-4
36
1
35
55
-21
1,580
8.9%
536
142
68
-2
72
1
71
131
-55
1,580
285
MAERSK TANKERS
2015
2014
9.0%
31
32
-2
-2
83
423
1,754
-0.5%
623
96
69
-2
25
+1
26
120
484
1,754
2.4%
2015
655
17
7
3:36
13
7
20
-1
286
8.9%
2015
1,338
18
14
2
4
10
12
-2
32
286
-1.5%
DAMCO
2014
785
-19
7
2
-24
8
-32
-71
-23
514
-25.8%
DAMCO
2014
1,534
-18
16
4
-30
12
-42
-133
-28
514
-18.0%
USD MILLION
SVITZER
2014
2015
161
50
21
2
5
36
4
32
49
-60
1,114
11.6%
2015
339
100
42
3
10
71
10
61
83
-105
1,114
USD MILLION
SVITZER
2014
11.3%
212
46
229353
20
37
28
-45
1,510
8.5%
20/42
429
99
40
3
13
75
10
65
76
-122
1,510
9.0%View entire presentation