Investor Presentation
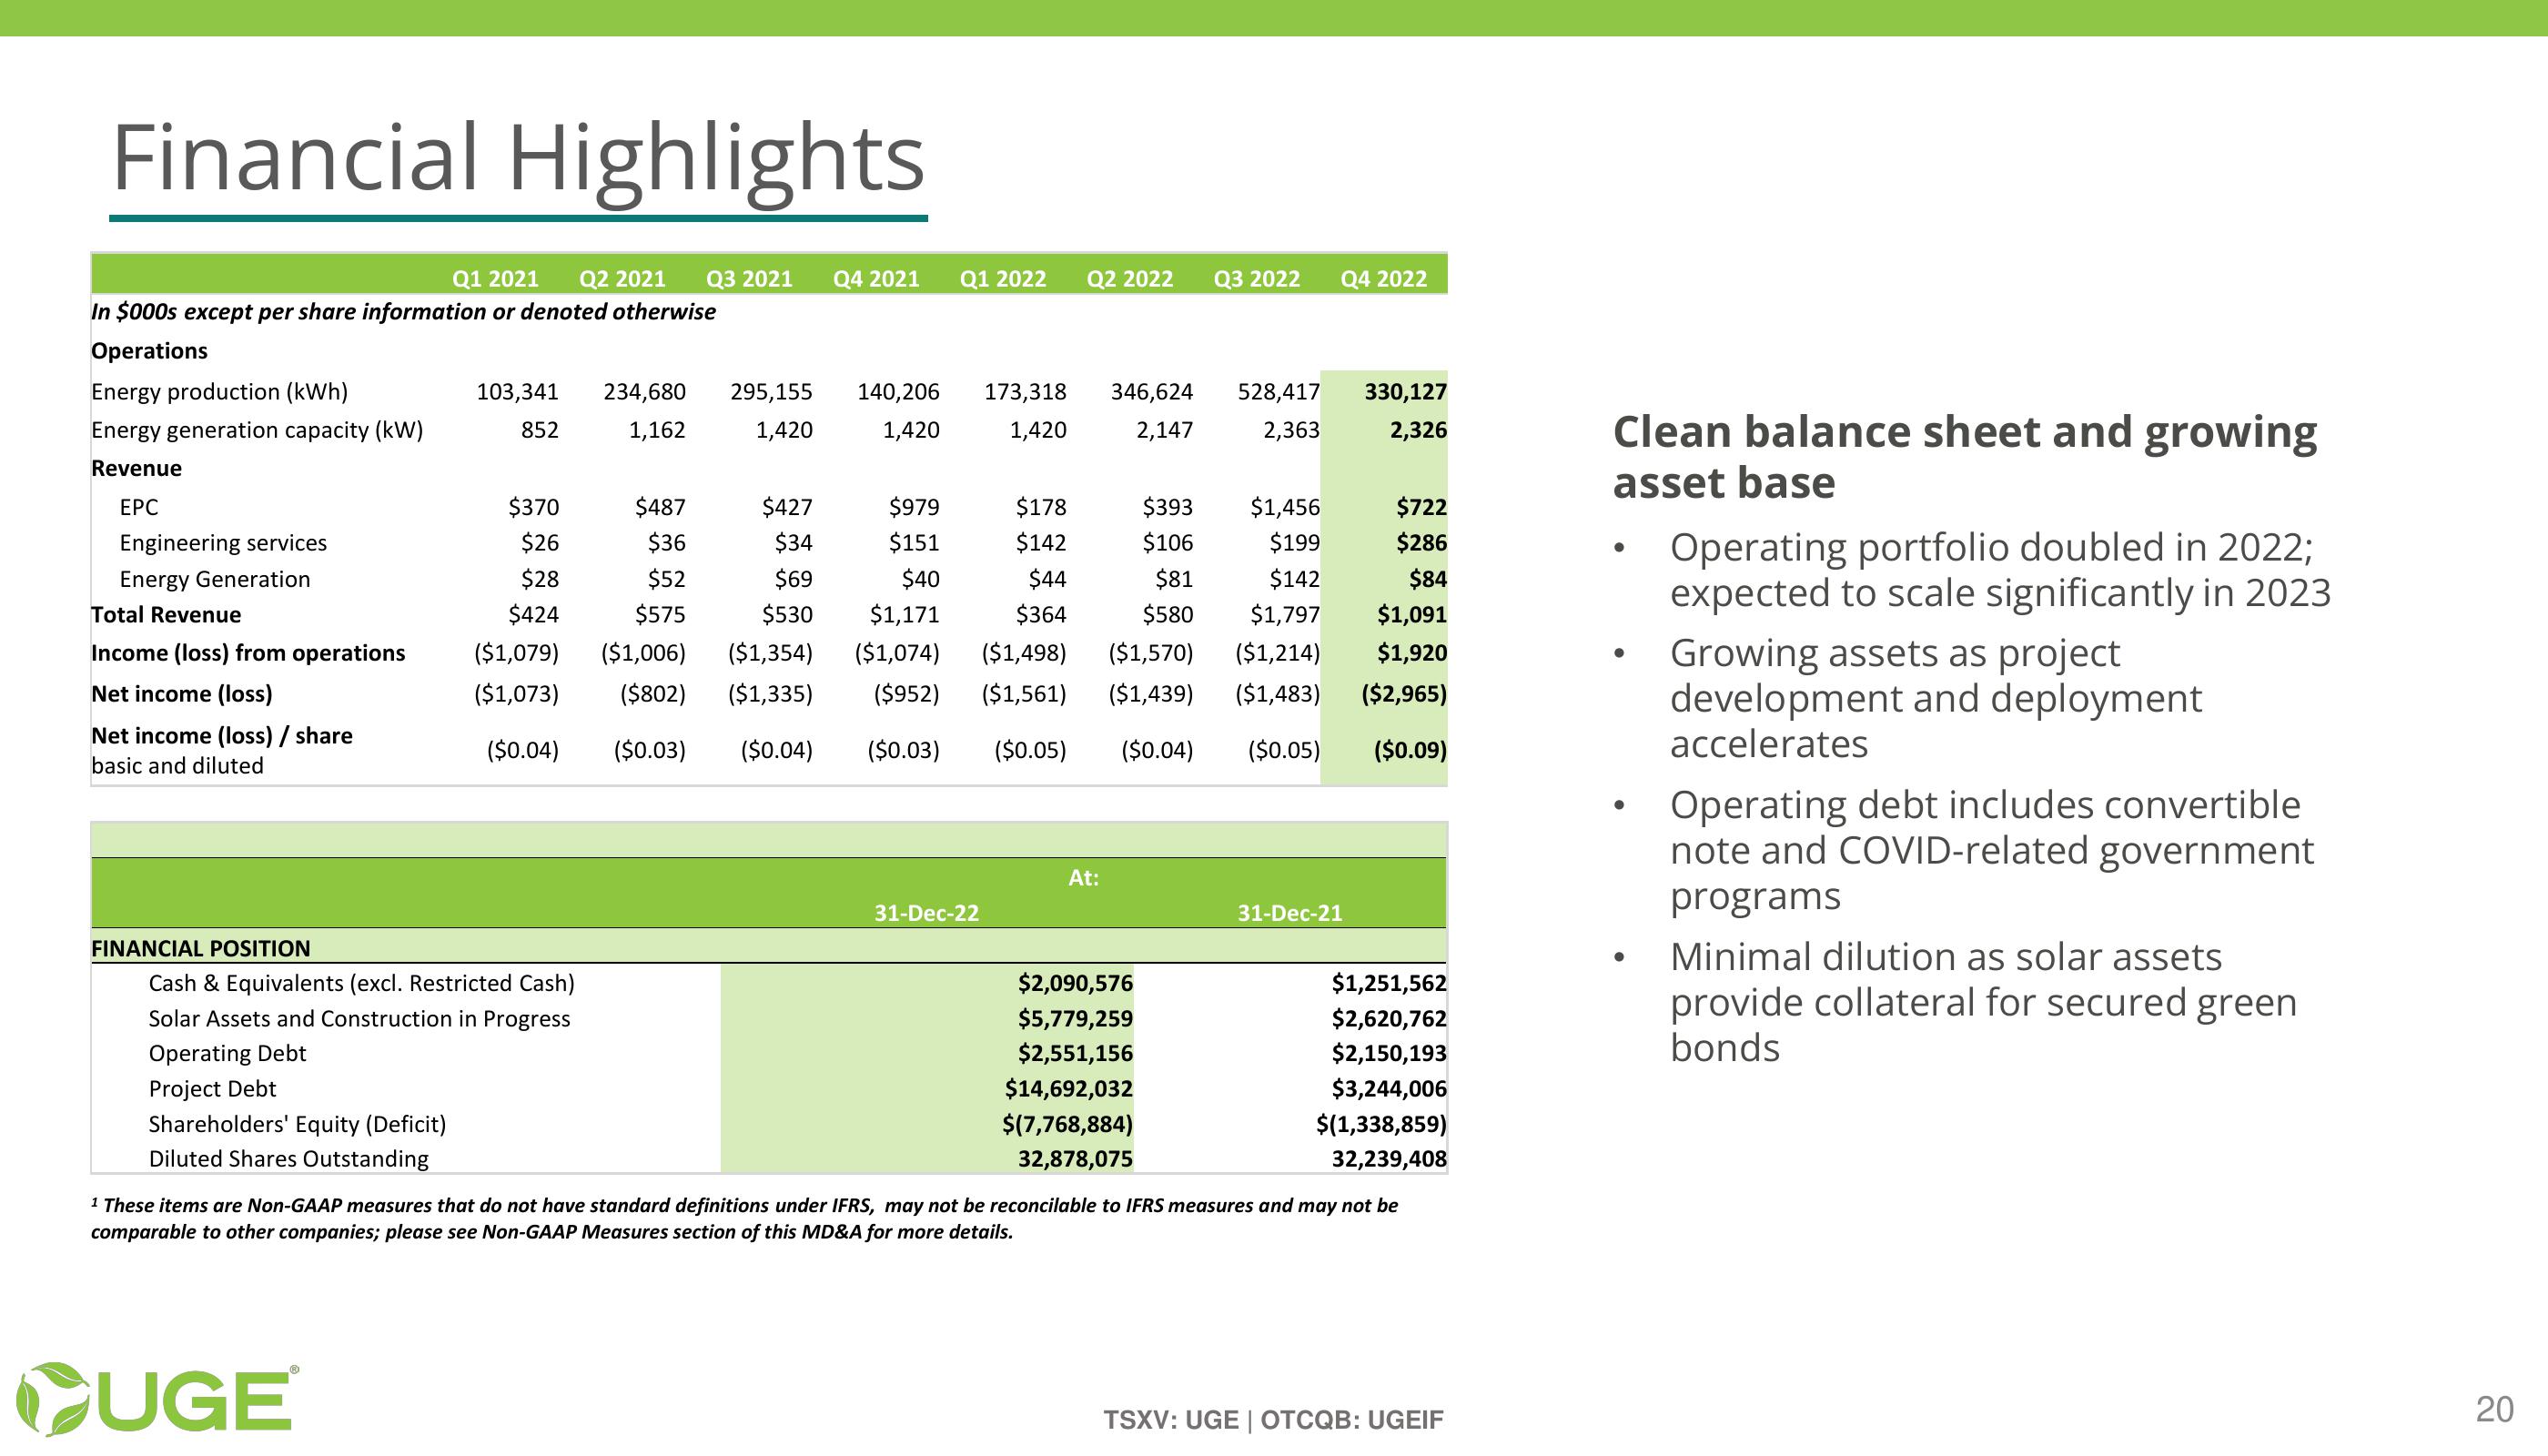
Financial Highlights
Q1 2021 Q2 2021
Q3 2021
Q4 2021
Q1 2022
Q2 2022
Q3 2022
Q4 2022
In $000s except per share information or denoted otherwise
Operations
Energy production (kWh)
103,341
234,680 295,155
140,206
173,318
346,624
528,417
Energy generation capacity (kW)
852
1,162
1,420
1,420
1,420
2,147
2,363
330,127
2,326
Revenue
EPC
$370
$487
$427
$979
$178
$393
$1,456
$722
Engineering services
$26
$36
$34
$151
$142
$106
$199
$286
Energy Generation
$28
$52
$69
$40
$44
$81
$142
$84
Total Revenue
$424
$575
$530
$1,171
$364
$580
$1,797
$1,091
Income (loss) from operations
($1,079)
($1,006)
($1,354)
($1,074)
($1,498)
($1,570)
($1,214)
$1,920
•
Net income (loss)
($1,073)
($802)
($1,335)
($952)
($1,561)
($1,439)
($1,483) ($2,965)
Net income (loss) / share
($0.04)
($0.03)
($0.04)
($0.03)
($0.05)
($0.04)
($0.05) ($0.09)
basic and diluted
FINANCIAL POSITION
Cash & Equivalents (excl. Restricted Cash)
Solar Assets and Construction in Progress
Operating Debt
Project Debt
Shareholders' Equity (Deficit)
At:
31-Dec-22
31-Dec-21
$2,090,576
$5,779,259
$2,551,156
$14,692,032
$(7,768,884)
32,878,075
Clean balance sheet and growing
asset base
•
•
Operating portfolio doubled in 2022;
expected to scale significantly in 2023
Growing assets as project
development and deployment
accelerates
Operating debt includes convertible
note and COVID-related government
programs
Minimal dilution as solar assets
provide collateral for secured green
bonds
•
$1,251,562
$2,620,762
$2,150,193
$3,244,006
$(1,338,859)
Diluted Shares Outstanding
32,239,408
1 These items are Non-GAAP measures that do not have standard definitions under IFRS, may not be reconcilable to IFRS measures and may not be
comparable to other companies; please see Non-GAAP Measures section of this MD&A for more details.
CUGE
TSXV: UGE | OTCQB: UGEIF
20
20View entire presentation