Kering Investor Presentation Deck
€M
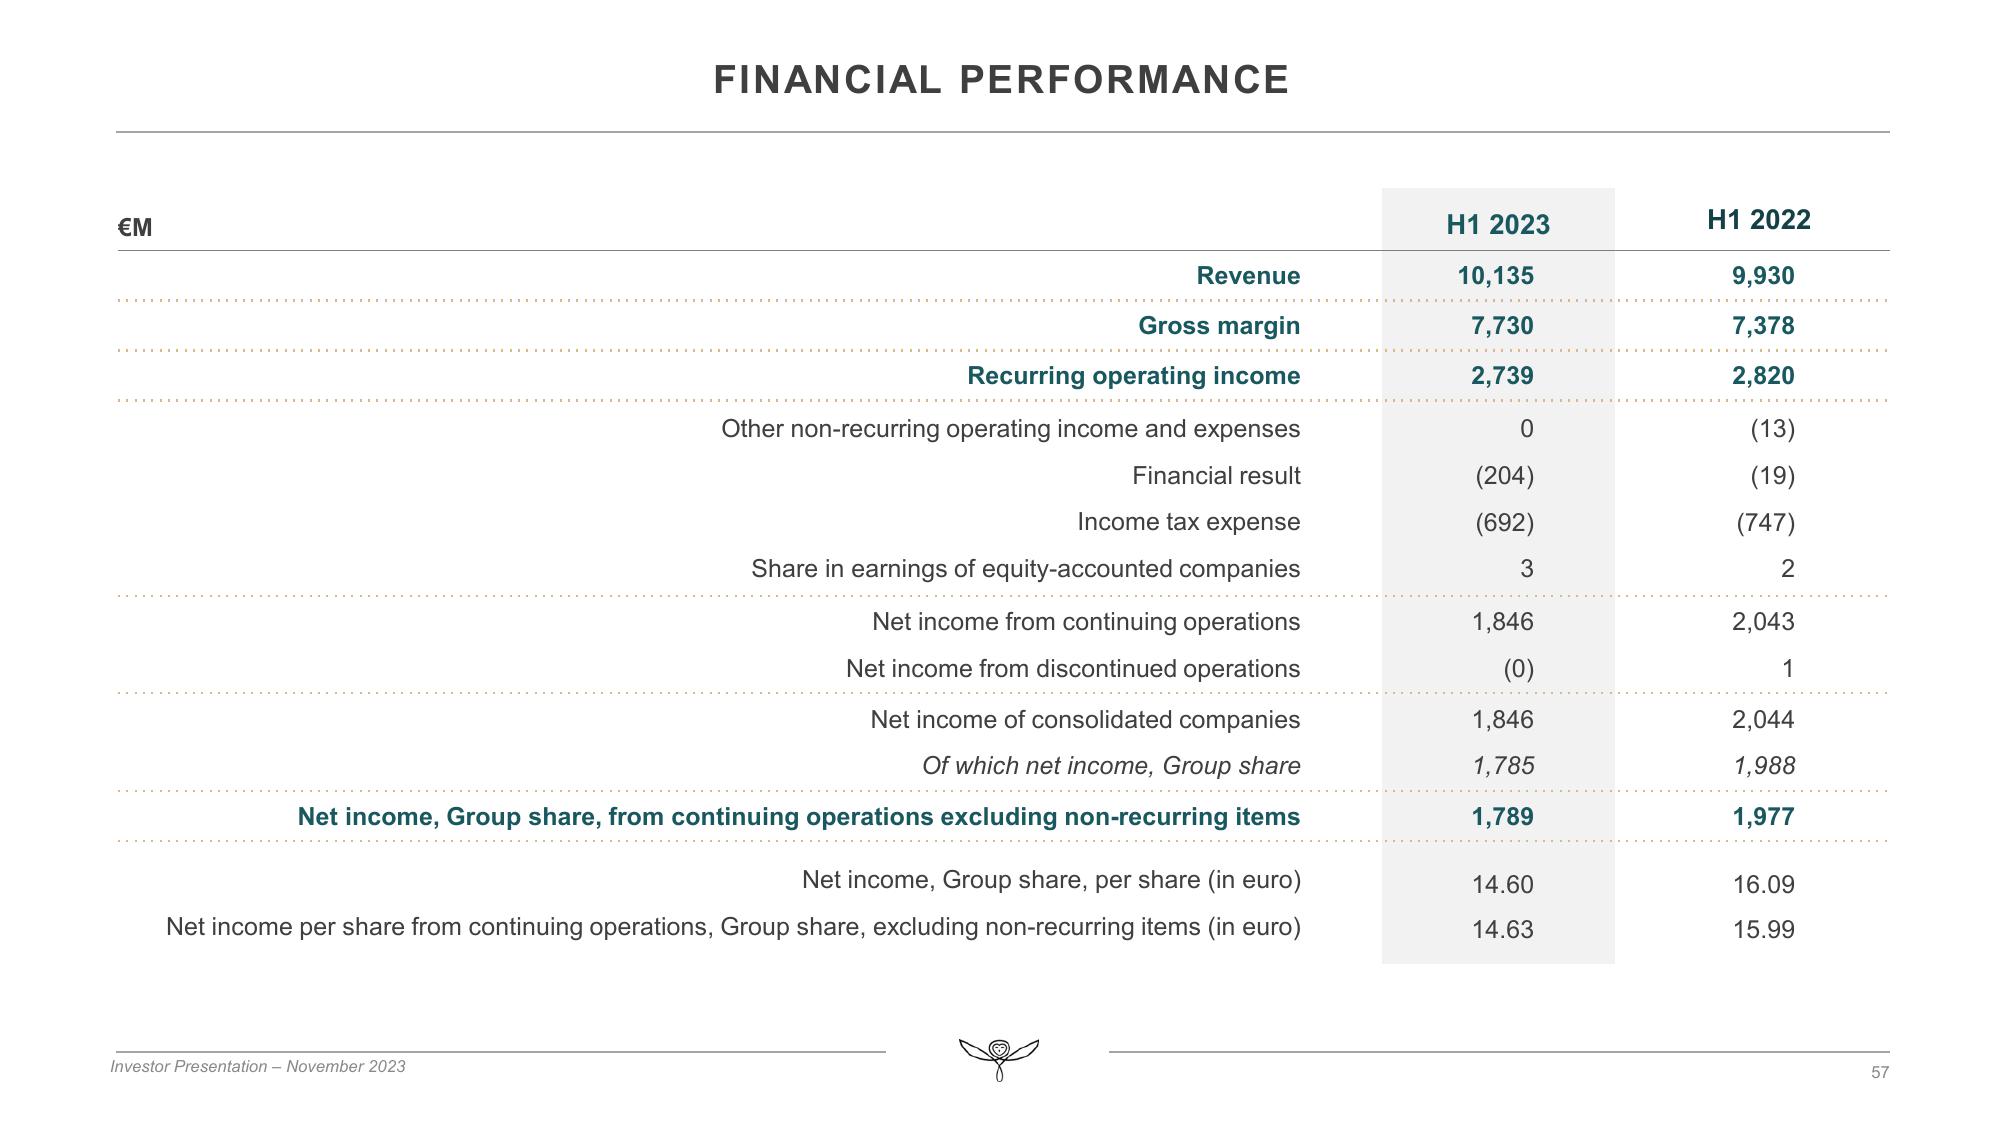
FINANCIAL PERFORMANCE
Investor Presentation - November 2023
Revenue
Gross margin
Recurring operating income
Other non-recurring operating income and expenses
Financial result
Income tax expense
Share in earnings of equity-accounted companies
Net income from continuing operations
Net income from discontinued operations
Net income of consolidated companies
Of which net income, Group share
Net income, Group share, from continuing operations excluding non-recurring items
Net income, Group share, per share (in euro)
Net income per share from continuing operations, Group share, excluding non-recurring items (in euro)
H1 2023
10,135
7,730
2,739
0
(204)
(692)
3
1,846
(0)
1,846
1,785
1,789
14.60
14.63
H1 2022
9,930
7,378
2,820
(13)
(19)
(747)
2
2,043
1
2,044
1,988
1,977
16.09
15.99
57View entire presentation