WeWork Results Presentation Deck
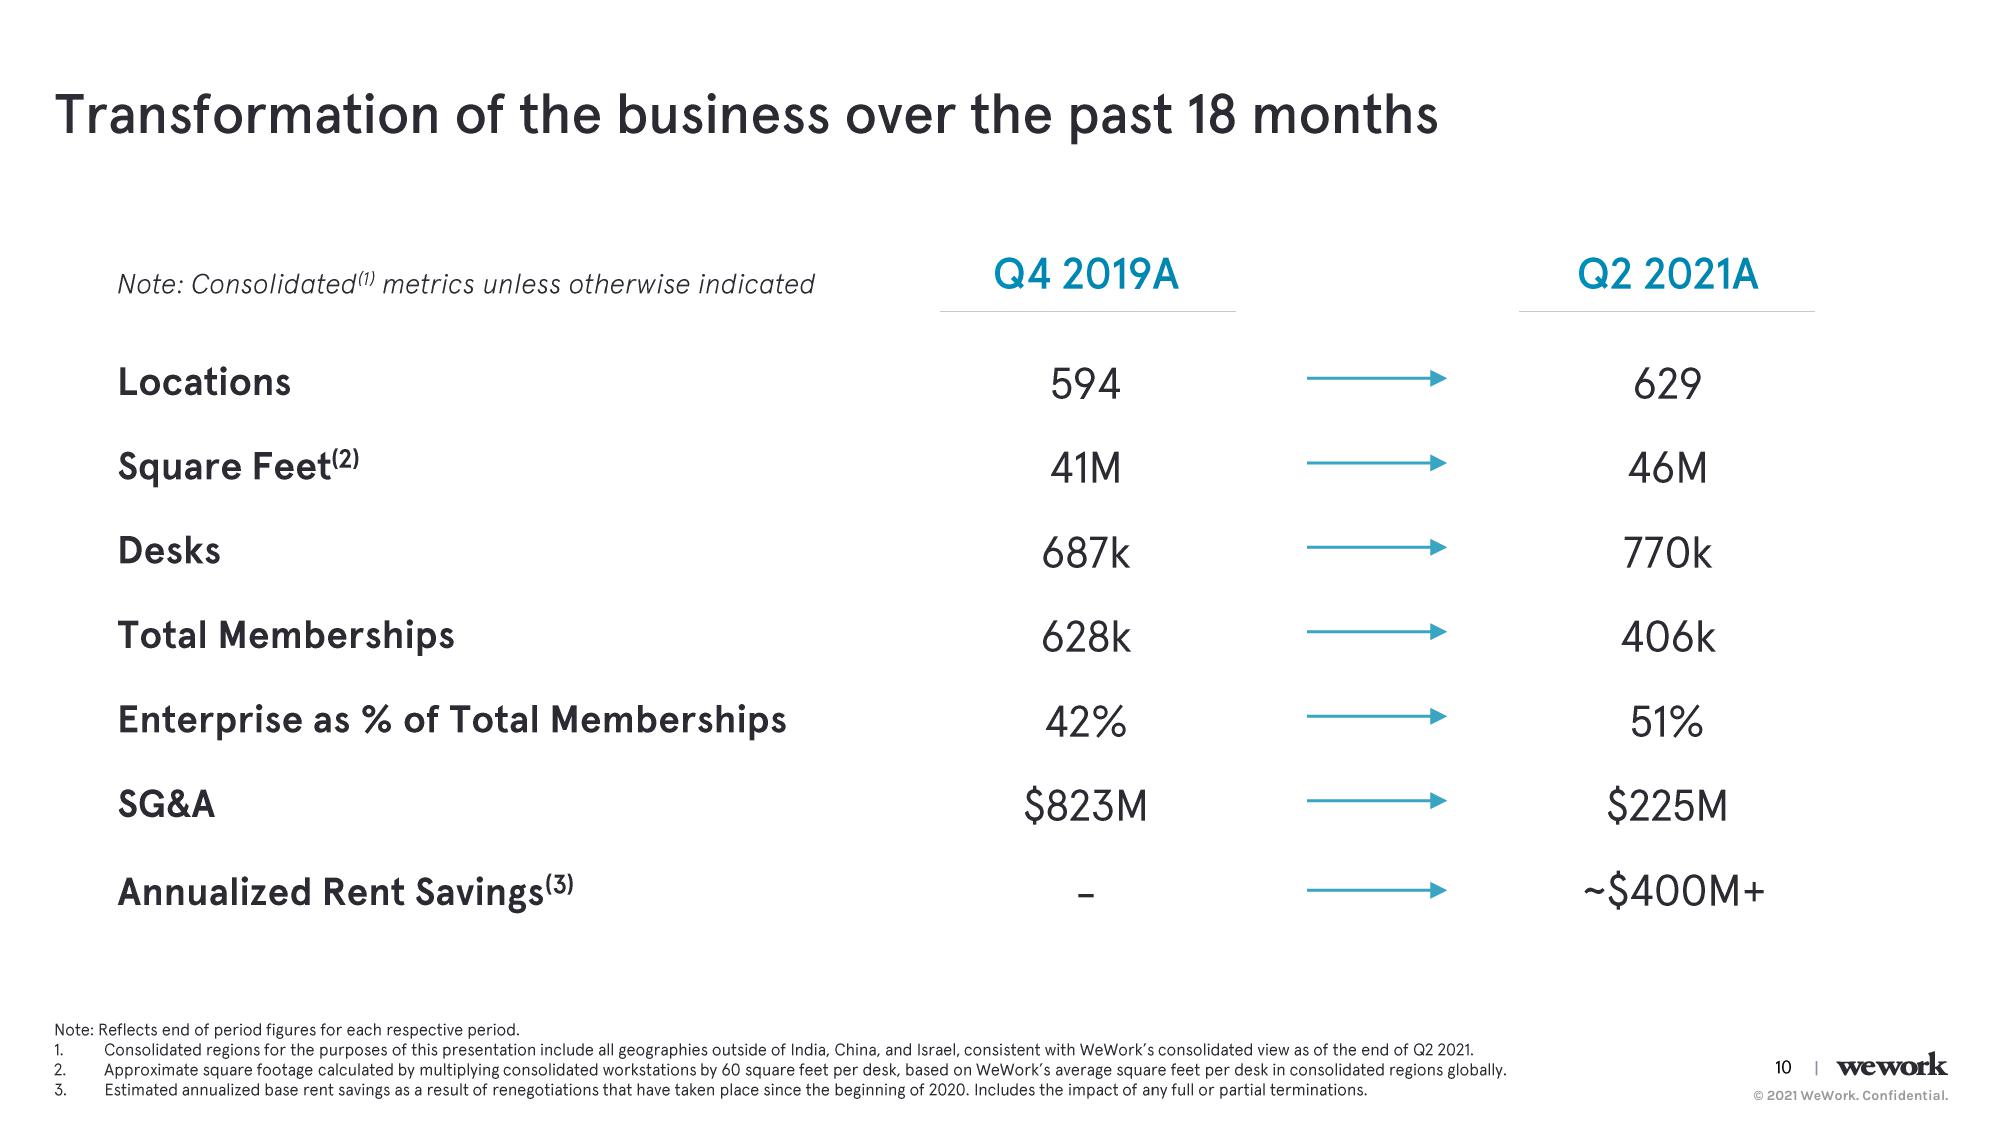
Transformation of the business over the past 18 months
Note: Consolidated(1) metrics unless otherwise indicated
1.
2.
3.
Locations
Square Feet (2)
Desks
Total Memberships
Enterprise as % of Total Memberships
SG&A
Annualized Rent Savings (3)
Q4 2019A
594
41M
687k
628k
42%
$823M
Note: Reflects end of period figures for each respective period.
Consolidated regions for the purposes of this presentation include all geographies outside of India, China, and Israel, consistent with WeWork's consolidated view as of the end of Q2 2021.
Approximate square footage calculated by multiplying consolidated workstations by 60 square feet per desk, based on WeWork's average square feet per desk in consolidated regions globally.
Estimated annualized base rent savings as a result of renegotiations that have taken place since the beginning of 2020. Includes the impact of any full or partial terminations.
Q2 2021A
629
46M
770k
406k
51%
$225M
-$400M+
10 | wework
Ⓒ2021 WeWork. Confidential.View entire presentation