Oatly Results Presentation Deck
Q1 2022 FINANCIALS OVERVIEW
TOPLINE MOMENTUM EXPECTED TO FURTHER ACCELERATE AS CAPACITY INCREASES
Production
volume(¹)
Sales
volume(1)
●
●
90
92
$140
REVENUE
Q1 2021
+19%
121
118
$166
Q1 2022
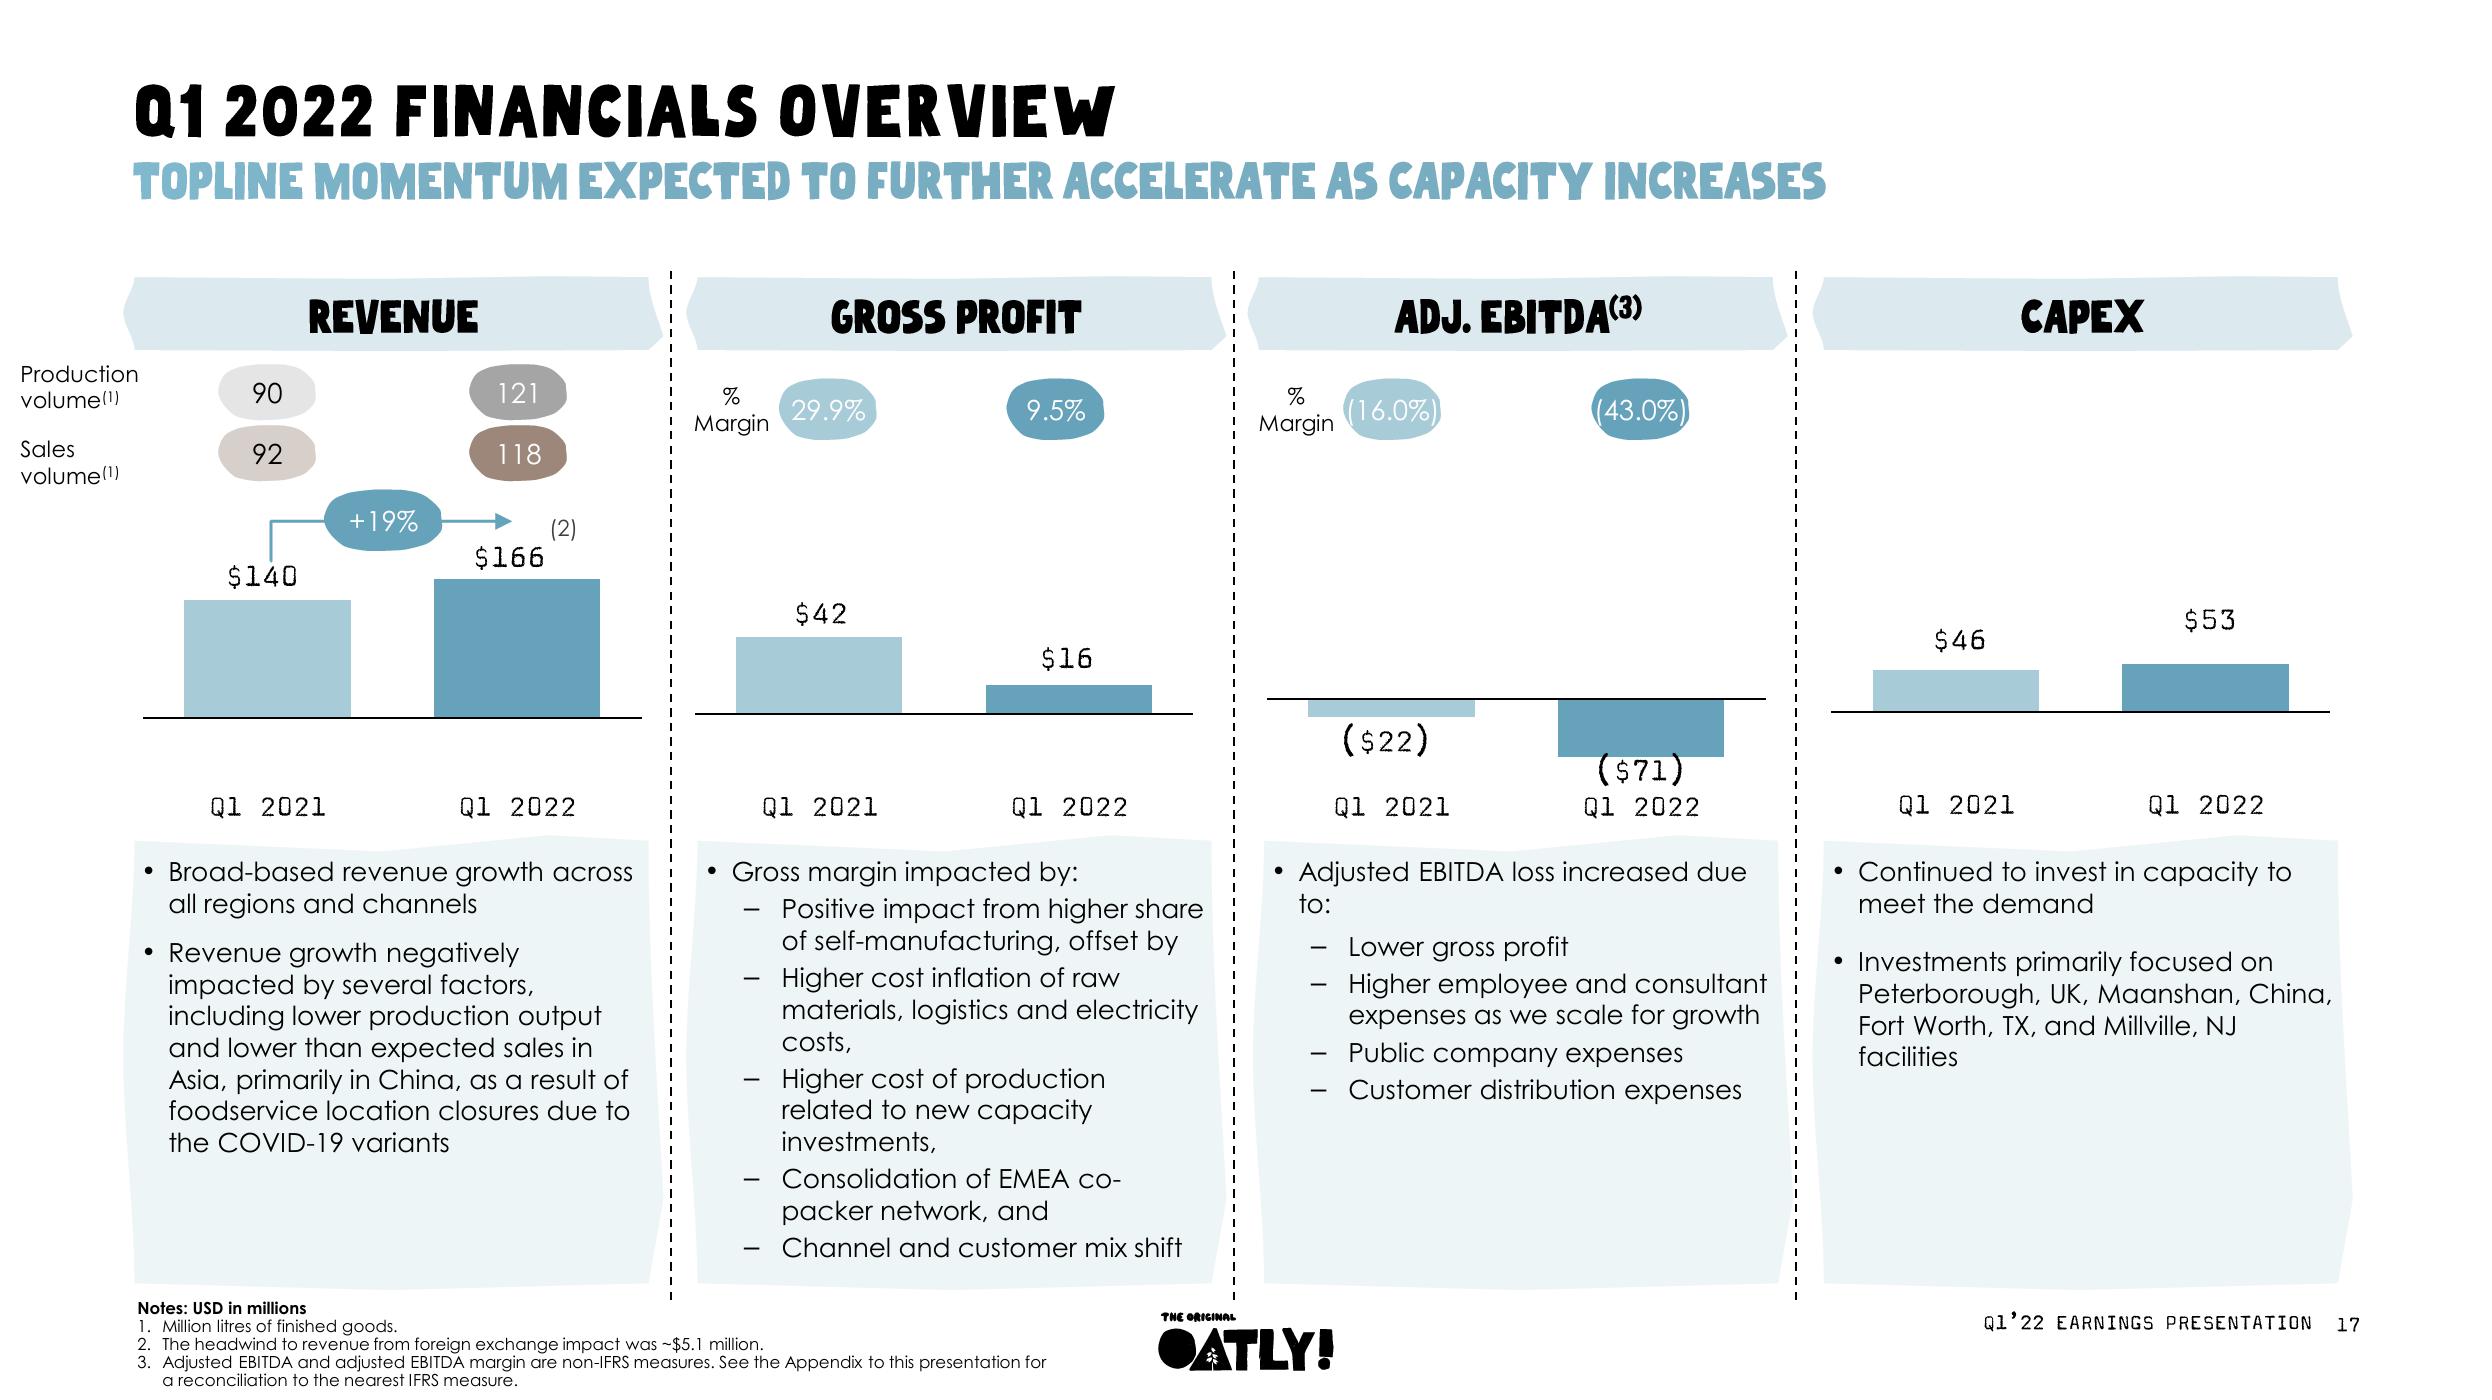
Broad-based revenue growth across
all regions and channels
Revenue growth negatively
impacted by several factors,
including lower production output
and lower than expected sales in
Asia, primarily in China, as a result of
foodservice location closures due to
the COVID-19 variants
%
Margin
●
-
-
GROSS PROFIT
-
29.9%
$42
Q1 2021
9.5%
Gross margin impacted by:
$16
Q1 2022
Positive impact from higher share
of self-manufacturing, offset by
Higher cost inflation of raw
materials, logistics and electricity
costs,
Higher cost of production
related to new capacity
investments,
Consolidation of EMEA co-
packer network, and
Channel and customer mix shift
Notes: USD in millions
1. Million litres of finished goods.
2. The headwind to revenue from foreign exchange impact was -$5.1 million.
3. Adjusted EBITDA and adjusted EBITDA margin are non-IFRS measures. See the Appendix to this presentation for
a reconciliation to the nearest IFRS measure.
THE ORIGINAL
%
Margin
●
-
-
ADJ. EBITDA(3)
(16.0%)
●ATLY!
($22)
Q1 2021
Adjusted EBITDA loss increased due
to:
(43.0%)
($71)
Q1 2022
Lower gross profit
Higher employee and consultant
expenses as we scale for growth
Public company expenses
Customer distribution expenses
$46
Q1 2021
CAPEX
$53
Q1 2022
• Continued to invest in capacity to
meet the demand
• Investments primarily focused on
Peterborough, UK, Maanshan, China,
Fort Worth, TX, and Millville, NJ
facilities
Q1'22 EARNINGS PRESENTATION
17View entire presentation