Zegna Results Presentation Deck
FY 2021 Preliminary Group Revenues by Product Line
Both Zegna branded Products & Thom Browne Providing Strong Growth
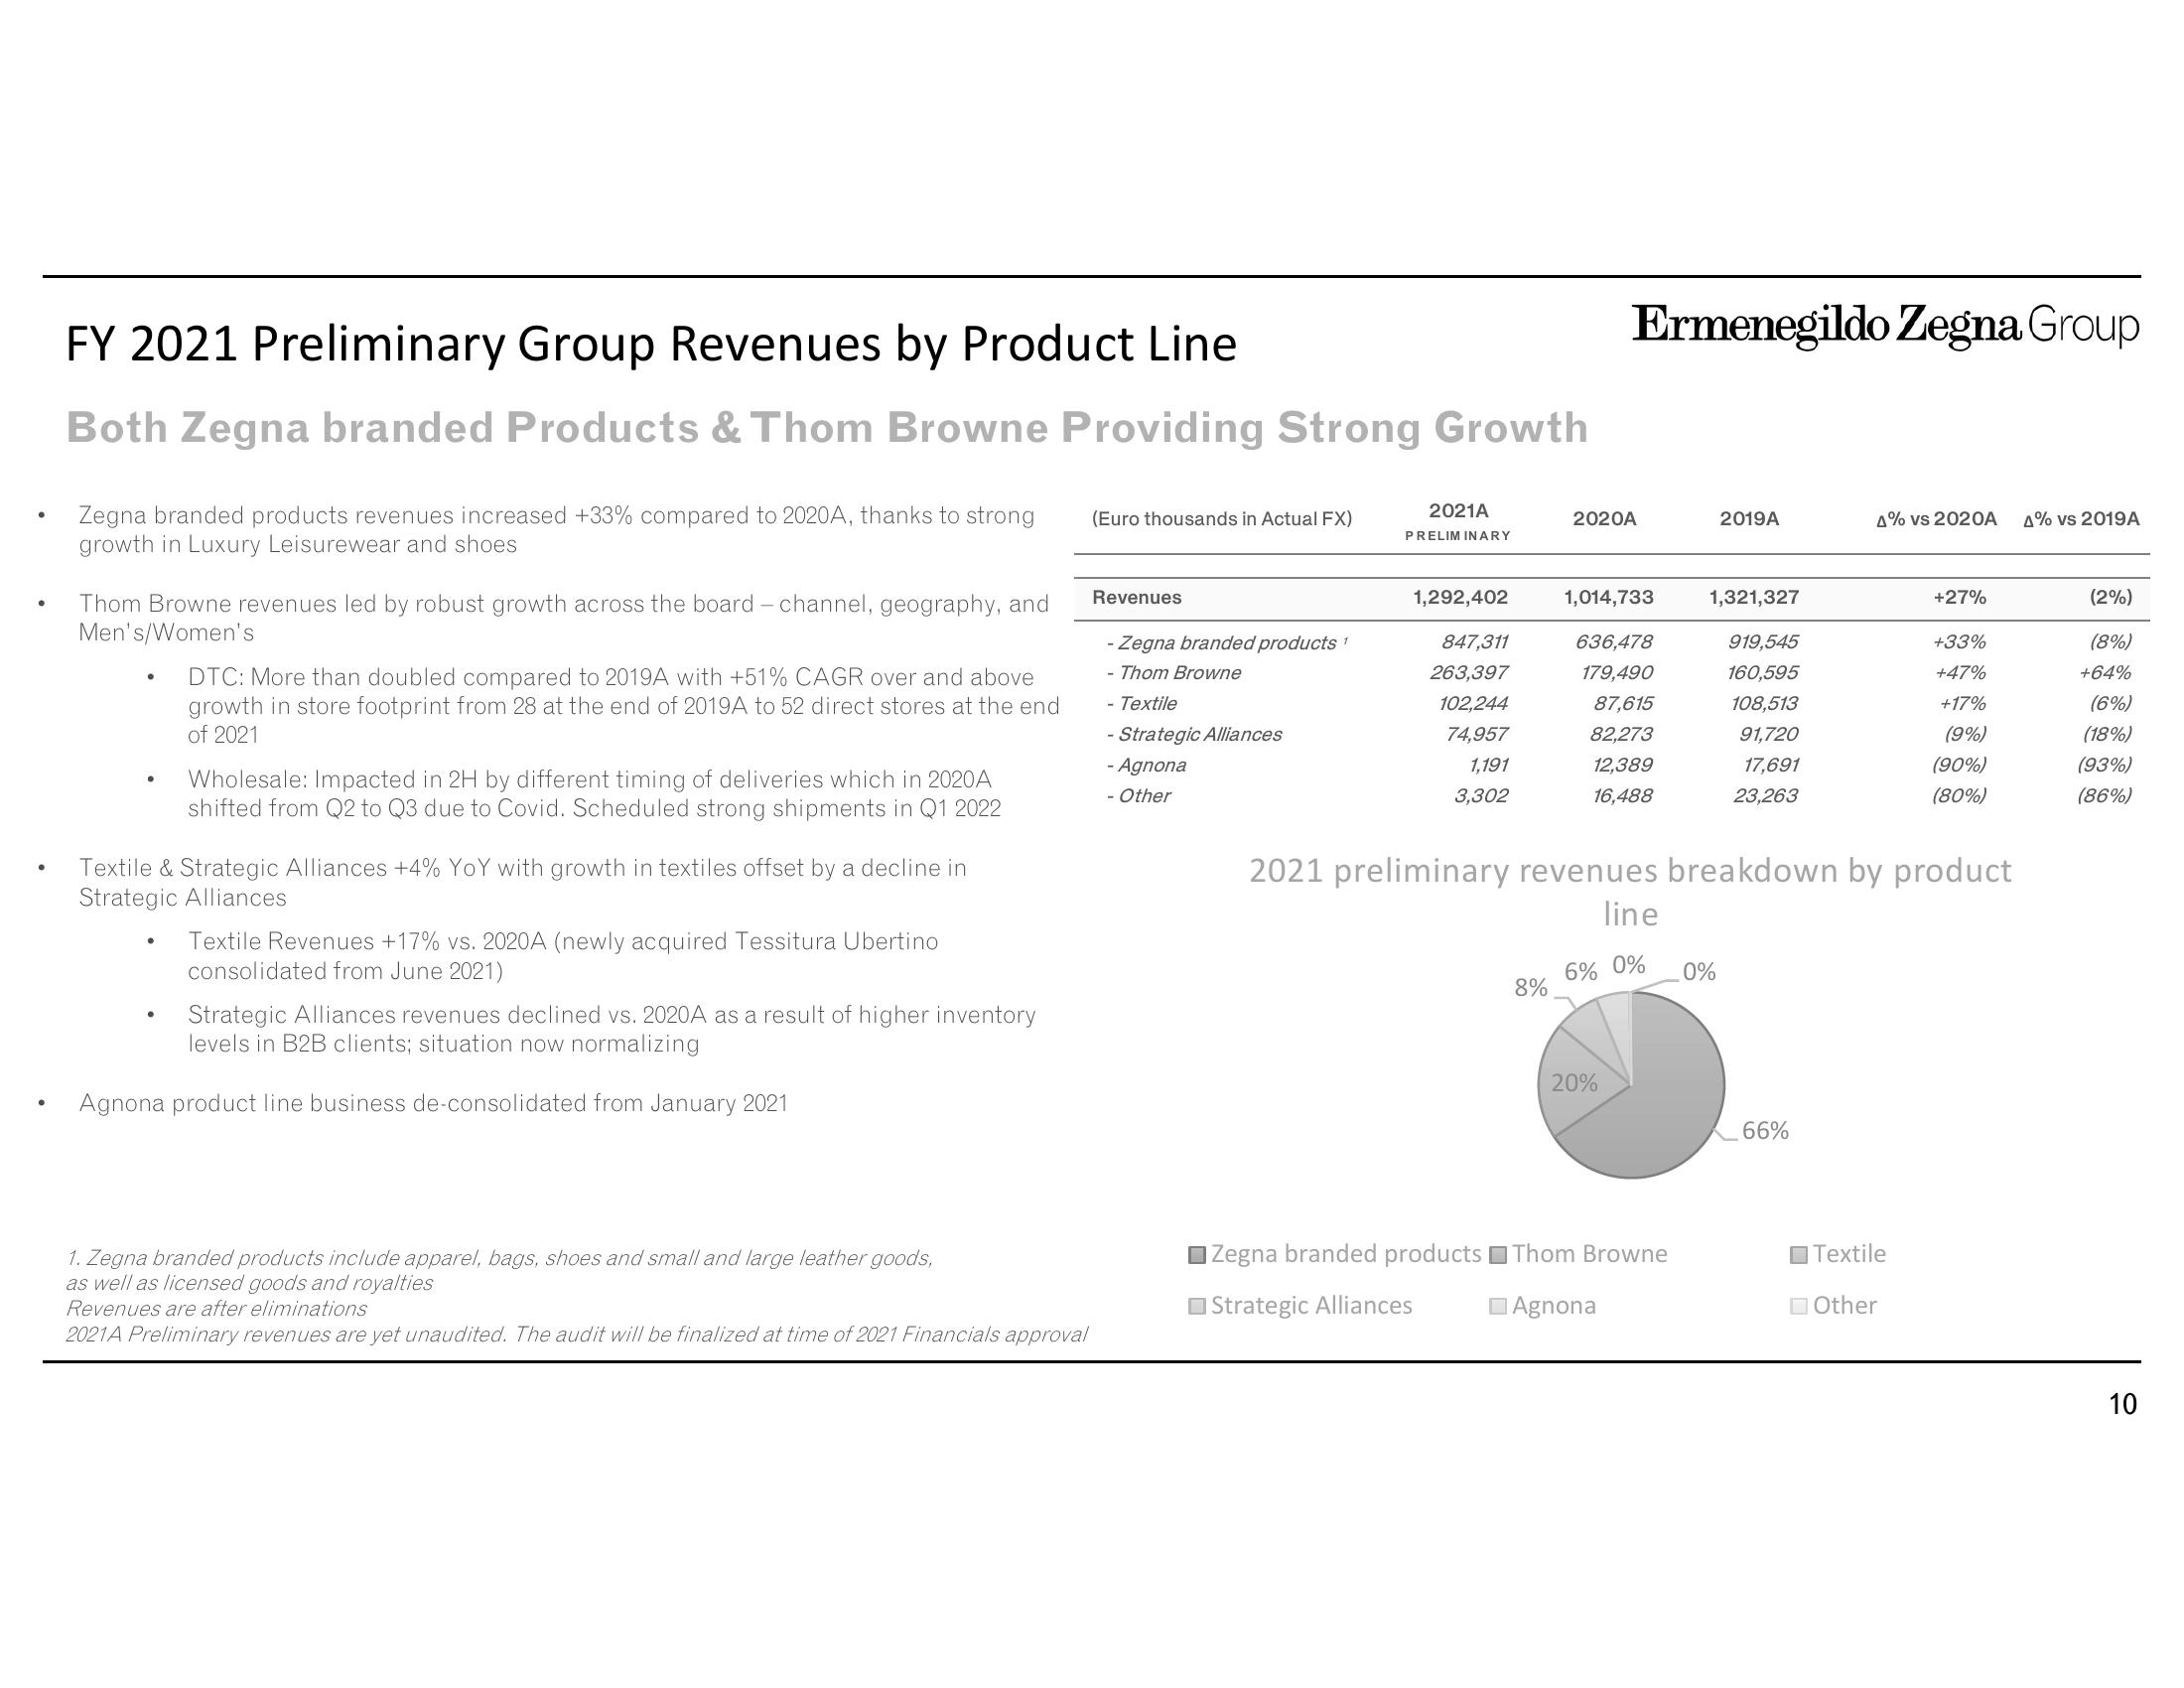
Zegna branded products revenues increased +33% compared to 2020A, thanks to strong
growth in Luxury Leisurewear and shoes
Thom Browne revenues led by robust growth across the board - channel, geography, and
Men's/Women's
DTC: More than doubled compared to 2019A with +51% CAGR over and above
growth in store footprint from 28 at the end of 2019A to 52 direct stores at the end
of 2021
Wholesale: Impacted in 2H by different timing of deliveries which in 2020A
shifted from Q2 to Q3 due to Covid. Scheduled strong shipments in Q1 2022
Textile & Strategic Alliances +4% YoY with growth in textiles offset by a decline in
Strategic Alliances
Textile Revenues +17% vs. 2020A (newly acquired Tessitura Ubertino
consolidated from June 2021)
Strategic Alliances revenues declined vs. 2020A as a result of higher inventory
levels in B2B clients; situation now normalizing
Agnona product line business de-consolidated from January 2021
1. Zegna branded products include apparel, bags, shoes and small and large leather goods,
as well as licensed goods and royalties
Revenues are after eliminations
2021A Preliminary revenues are yet unaudited. The audit will be finalized at time of 2021 Financials approval
(Euro thousands in Actual FX)
Revenues
- Zegna branded products 1
- Thom Browne
- Textile
Strategic Alliances
- Agnona
- Other
2021A
PRELIMINARY
1,292,402
847,311
263,397
102,244
74,957
1,191
3,302
☐Zegna branded products
Strategic Alliances
8%
Ermenegildo Zegna Group
2020A
1,014,733
636,478
179,490
87,615
82,273
12,389
16,488
6% 0%
20%
2021 preliminary revenues breakdown by product
line
Thom Browne
Agnona
2019A
1,321,327
919,545
160,595
108,513
91,720
17,691
23,263
0%
4% vs 2020A
66%
+27%
Textile
Other
+33%
+47%
+17%
(9%)
(90%)
(80%)
4% vs 2019A
(2%)
(8%)
+64%
(6%)
(18%)
(93%)
(86%)
10View entire presentation