HSBC Results Presentation Deck
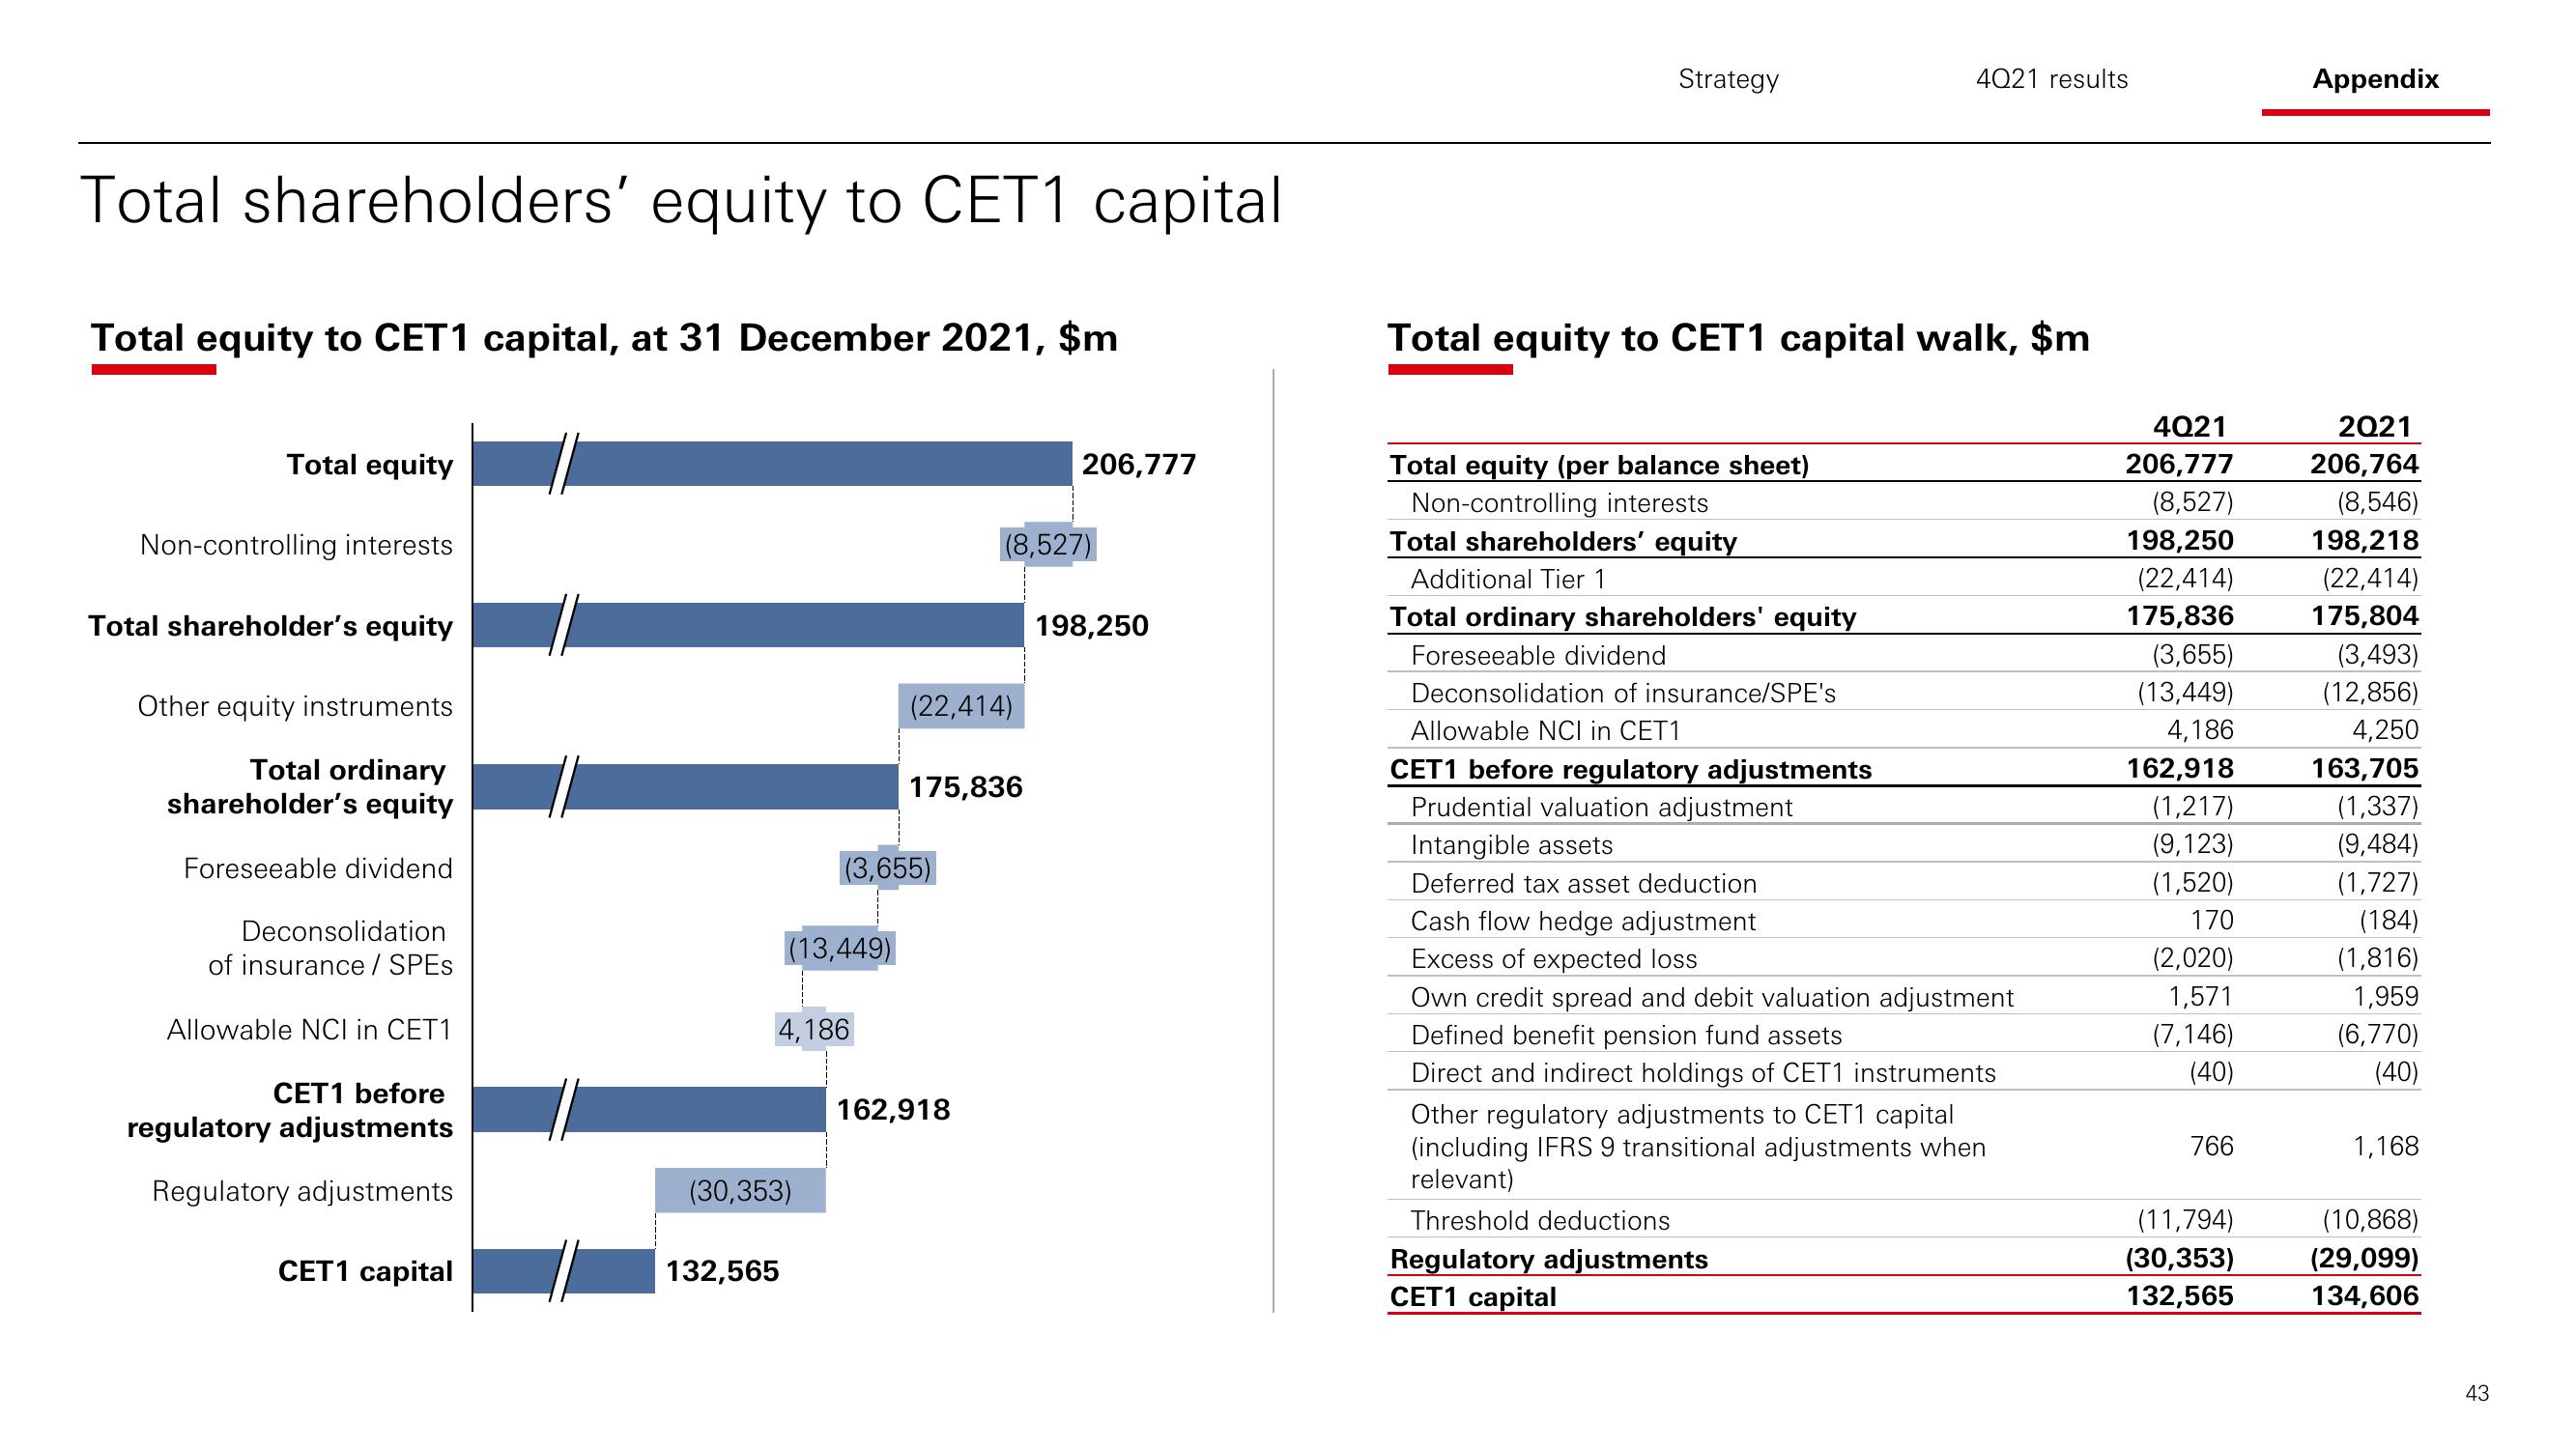
Total shareholders' equity to CET1 capital
Total equity to CET1 capital, at 31 December 2021, $m
Total equity
Non-controlling interests
Total shareholder's equity
Other equity instruments
Total ordinary
shareholder's equity
Foreseeable dividend
Deconsolidation
of insurance / SPES
Allowable NCI in CET1
CET1 before
regulatory adjustments
Regulatory adjustments
CET1 capital
(13,449)
4,186
(30,353)
132,565
(3,655)
(22,414)
175,836
(8,527)
162,918
206,777
198,250
Strategy
Total equity to CET1 capital walk, $m
Total equity (per balance sheet)
Non-controlling interests
Total shareholders' equity
Additional Tier 1
4021 results
Total ordinary shareholders' equity
Foreseeable dividend
Deconsolidation of insurance/SPE's
Allowable NCI in CET1
CET1 before regulatory adjustments
Prudential valuation adjustment
Intangible assets
Deferred tax asset deduction
Cash flow hedge adjustment
Excess of expected loss
Own credit spread and debit valuation adjustment
Defined benefit pension fund assets
Direct and indirect holdings of CET1 instruments
Other regulatory adjustments to CET1 capital
(including IFRS 9 transitional adjustments when
relevant)
Threshold deductions
Regulatory adjustments
CET1 capital
4Q21
206,777
(8,527)
198,250
(22,414)
175,836
(3,655)
(13,449)
4,186
162,918
(1,217)
(9,123)
(1,520)
170
(2,020)
1,571
(7,146)
(40)
766
(11,794)
(30,353)
132,565
Appendix
2Q21
206,764
(8,546)
198,218
(22,414)
175,804
(3,493)
(12,856)
4,250
163,705
(1,337)
(9,484
(1,727)
(184)
(1,816)
1,959
(6,770)
(40)
1,168
(10,868)
(29,099)
134,606
43View entire presentation