Silicon Valley Bank Results Presentation Deck
Non-GAAP reconciliation*
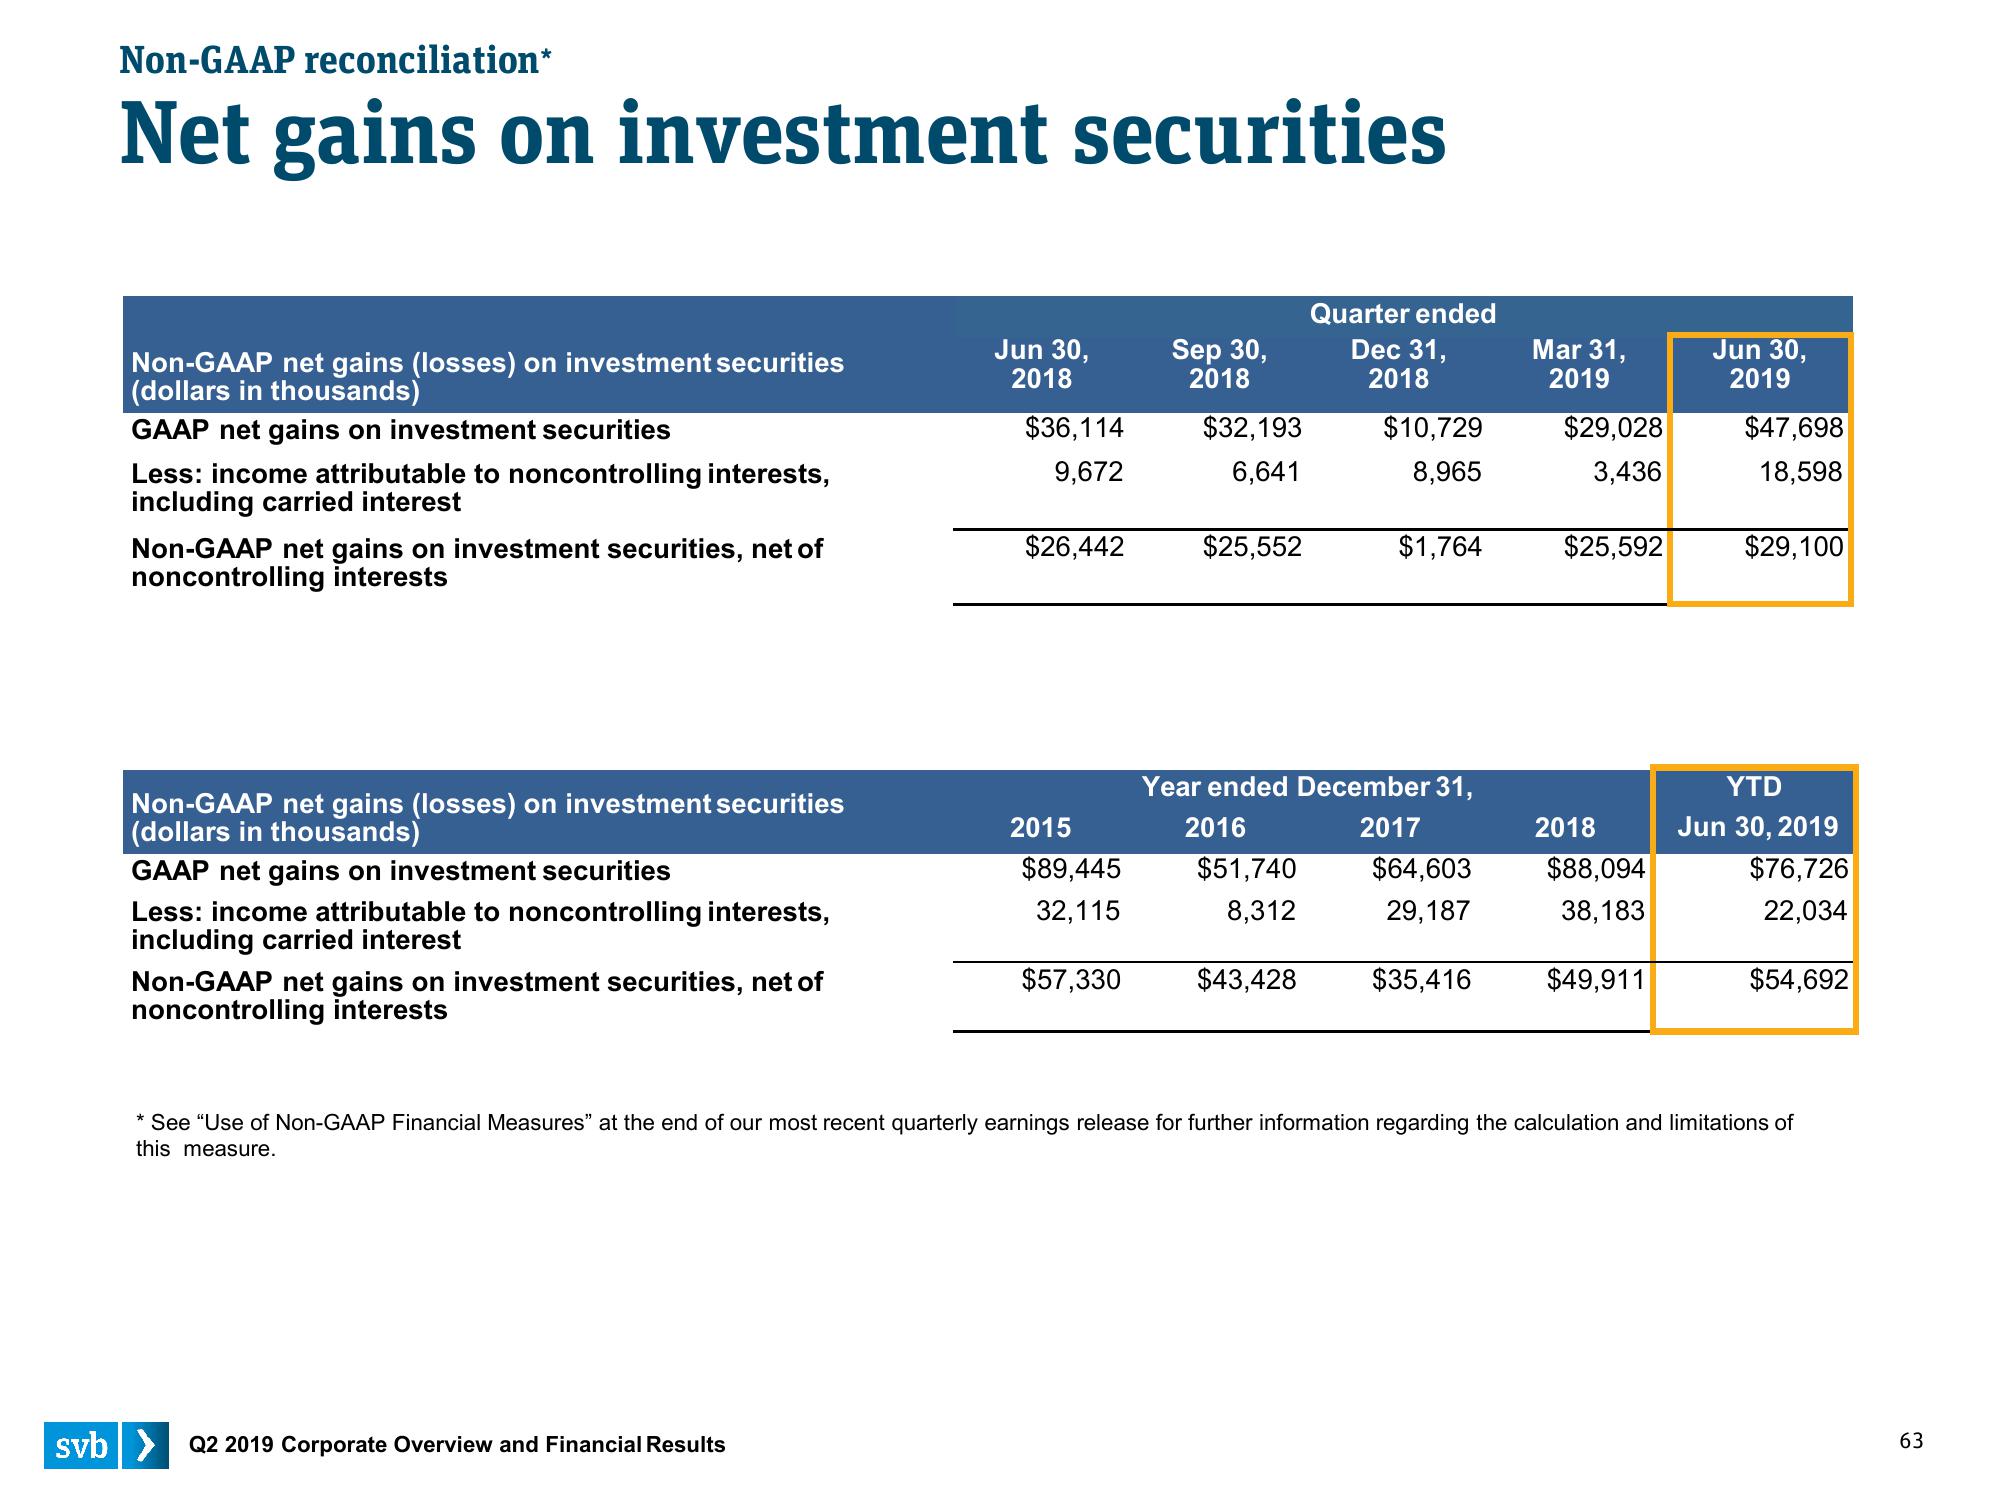
Net gains on investment securities
Non-GAAP net gains (losses) on investment securities
(dollars in thousands)
GAAP net gains on investment securities
Less: income attributable to noncontrolling interests,
including carried interest
Non-GAAP net gains on investment securities, net of
noncontrolling interests
Non-GAAP net gains (losses) on investment securities
(dollars in thousands)
GAAP net gains on investment securities
Less: income attributable to noncontrolling interests,
including carried interest
Non-GAAP net gains on investment securities, net of
noncontrolling interests
Jun 30,
2018
svb> Q2 2019 Corporate Overview and Financial Results
$36,114
9,672
$26,442
2015
$89,445
32,115
$57,330
Sep 30,
2018
$32,193
6,641
$25,552
$51,740
8,312
Quarter ended
Dec 31,
2018
$43,428
$10,729
8,965
Year ended December 31,
2016
2017
$1,764
$64,603
29,187
$35,416
Mar 31,
2019
$29,028
3,436
$25,592
2018
$88,094
38,183
$49,911
Jun 30,
2019
$47,698
18,598
$29,100
YTD
Jun 30, 2019
$76,726
22,034
$54,692
* See "Use of Non-GAAP Financial Measures" at the end of our most recent quarterly earnings release for further information regarding the calculation and limitations of
this measure.
63View entire presentation