IBM Results Presentation Deck slide image

IBM Results Presentation Deck

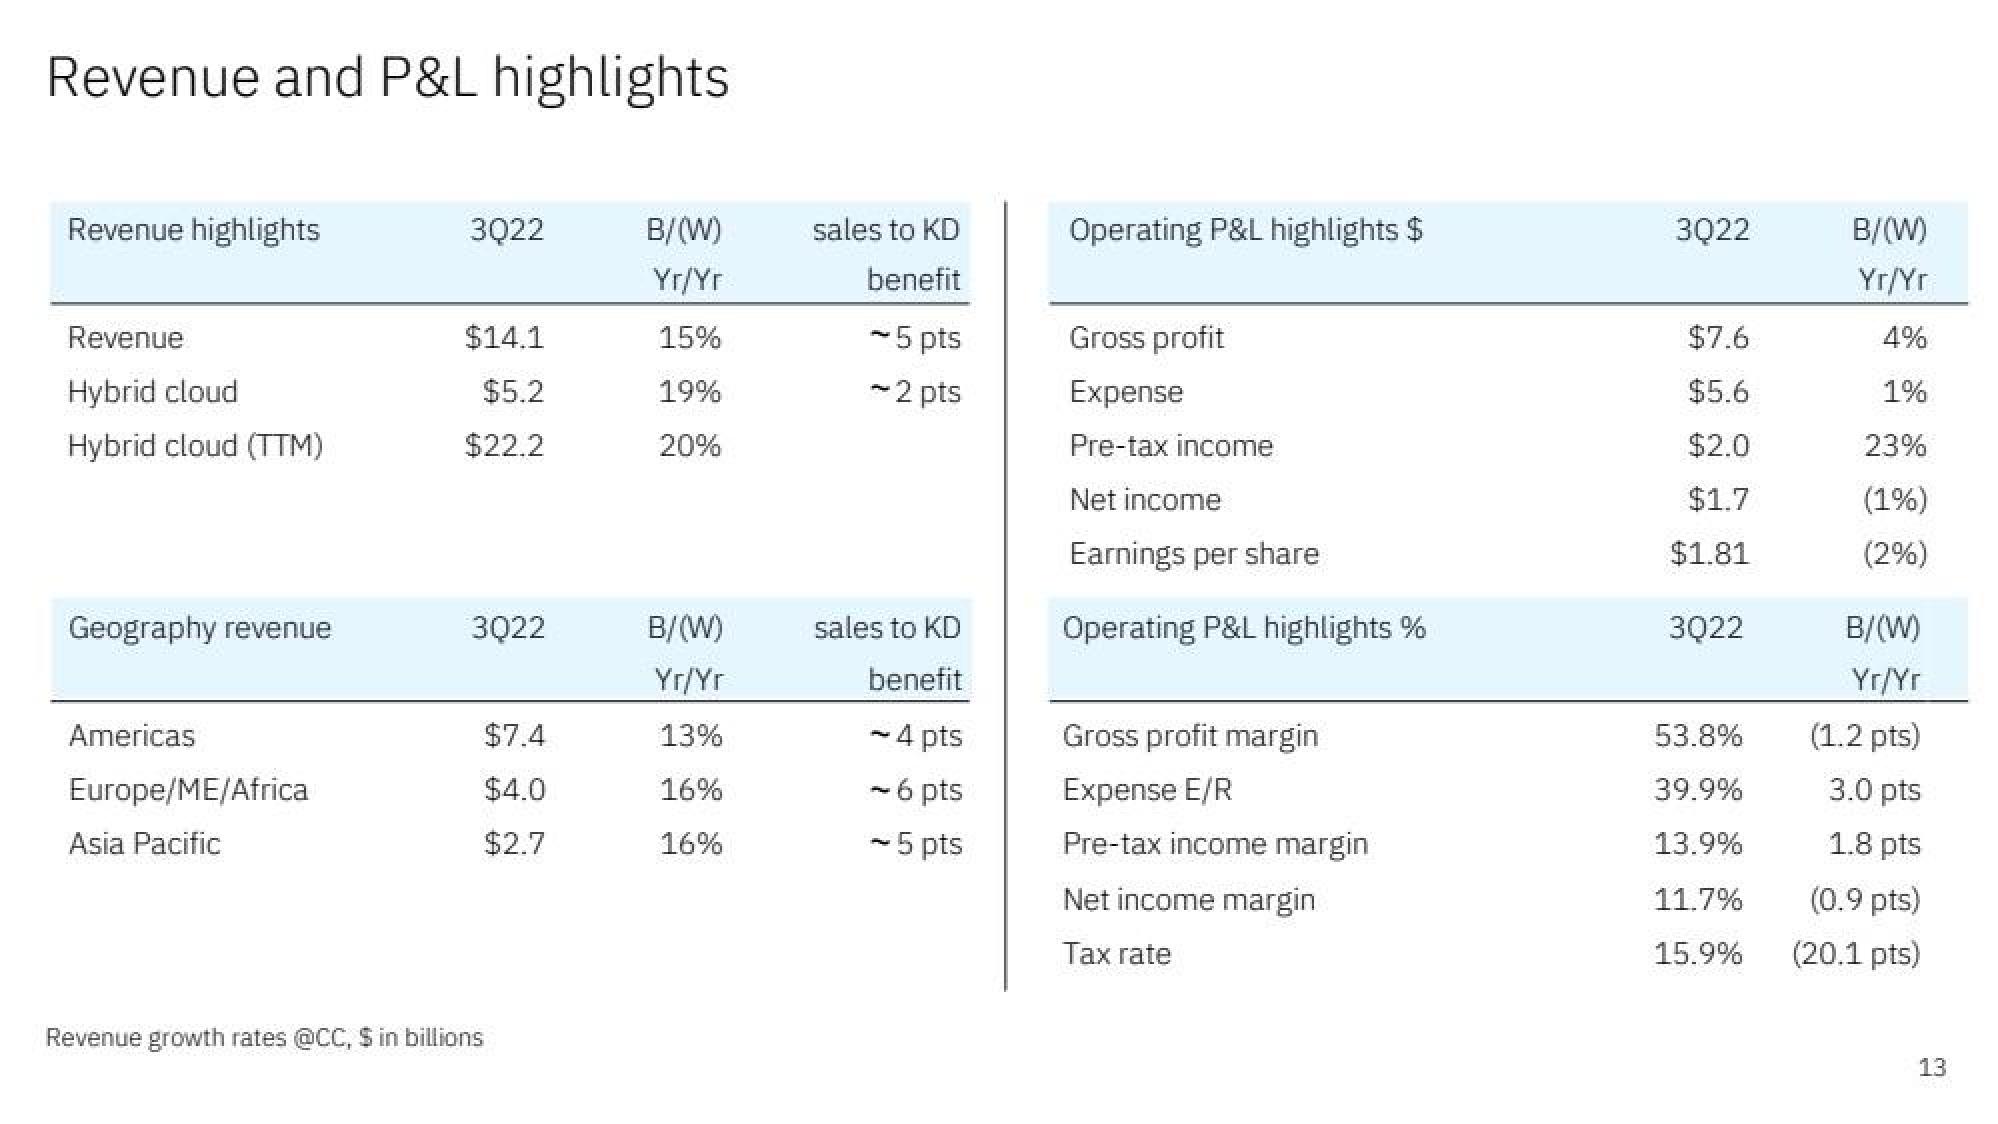
Revenue and P&L highlights Revenue highlights Revenue Hybrid cloud Hybrid cloud (TTM) Geography revenue Americas Europe/ME/Africa Asia Pacific 3Q22 $14.1 $5.2 $22.2 3022 Revenue growth rates @CC, $ in billions $7.4 $4.0 $2.7 B/(W) Yr/Yr 15% 19% 20% B/(W) Yr/Yr 13% 16% 16% sales to KD benefit ~5 pts ~2 pts sales to KD benefit ~ 4 pts ~ 6 pts - 5 pts Operating P&L highlights $ Gross profit Expense Pre-tax income Net income Earnings per share Operating P&L highlights % Gross profit margin Expense E/R Pre-tax income margin Net income margin Tax rate 3Q22 $7.6 $5.6 $2.0 $1.7 $1.81 3Q22 53.8% 39.9% 13.9% 11.7% 15.9% B/(W) Yr/Yr 4% 1% 23% (1%) (2%) B/(W) Yr/Yr (1.2 pts) 3.0 pts 1.8 pts (0.9 pts) (20.1 pts) 13
View entire presentation