Evolv SPAC Presentation Deck
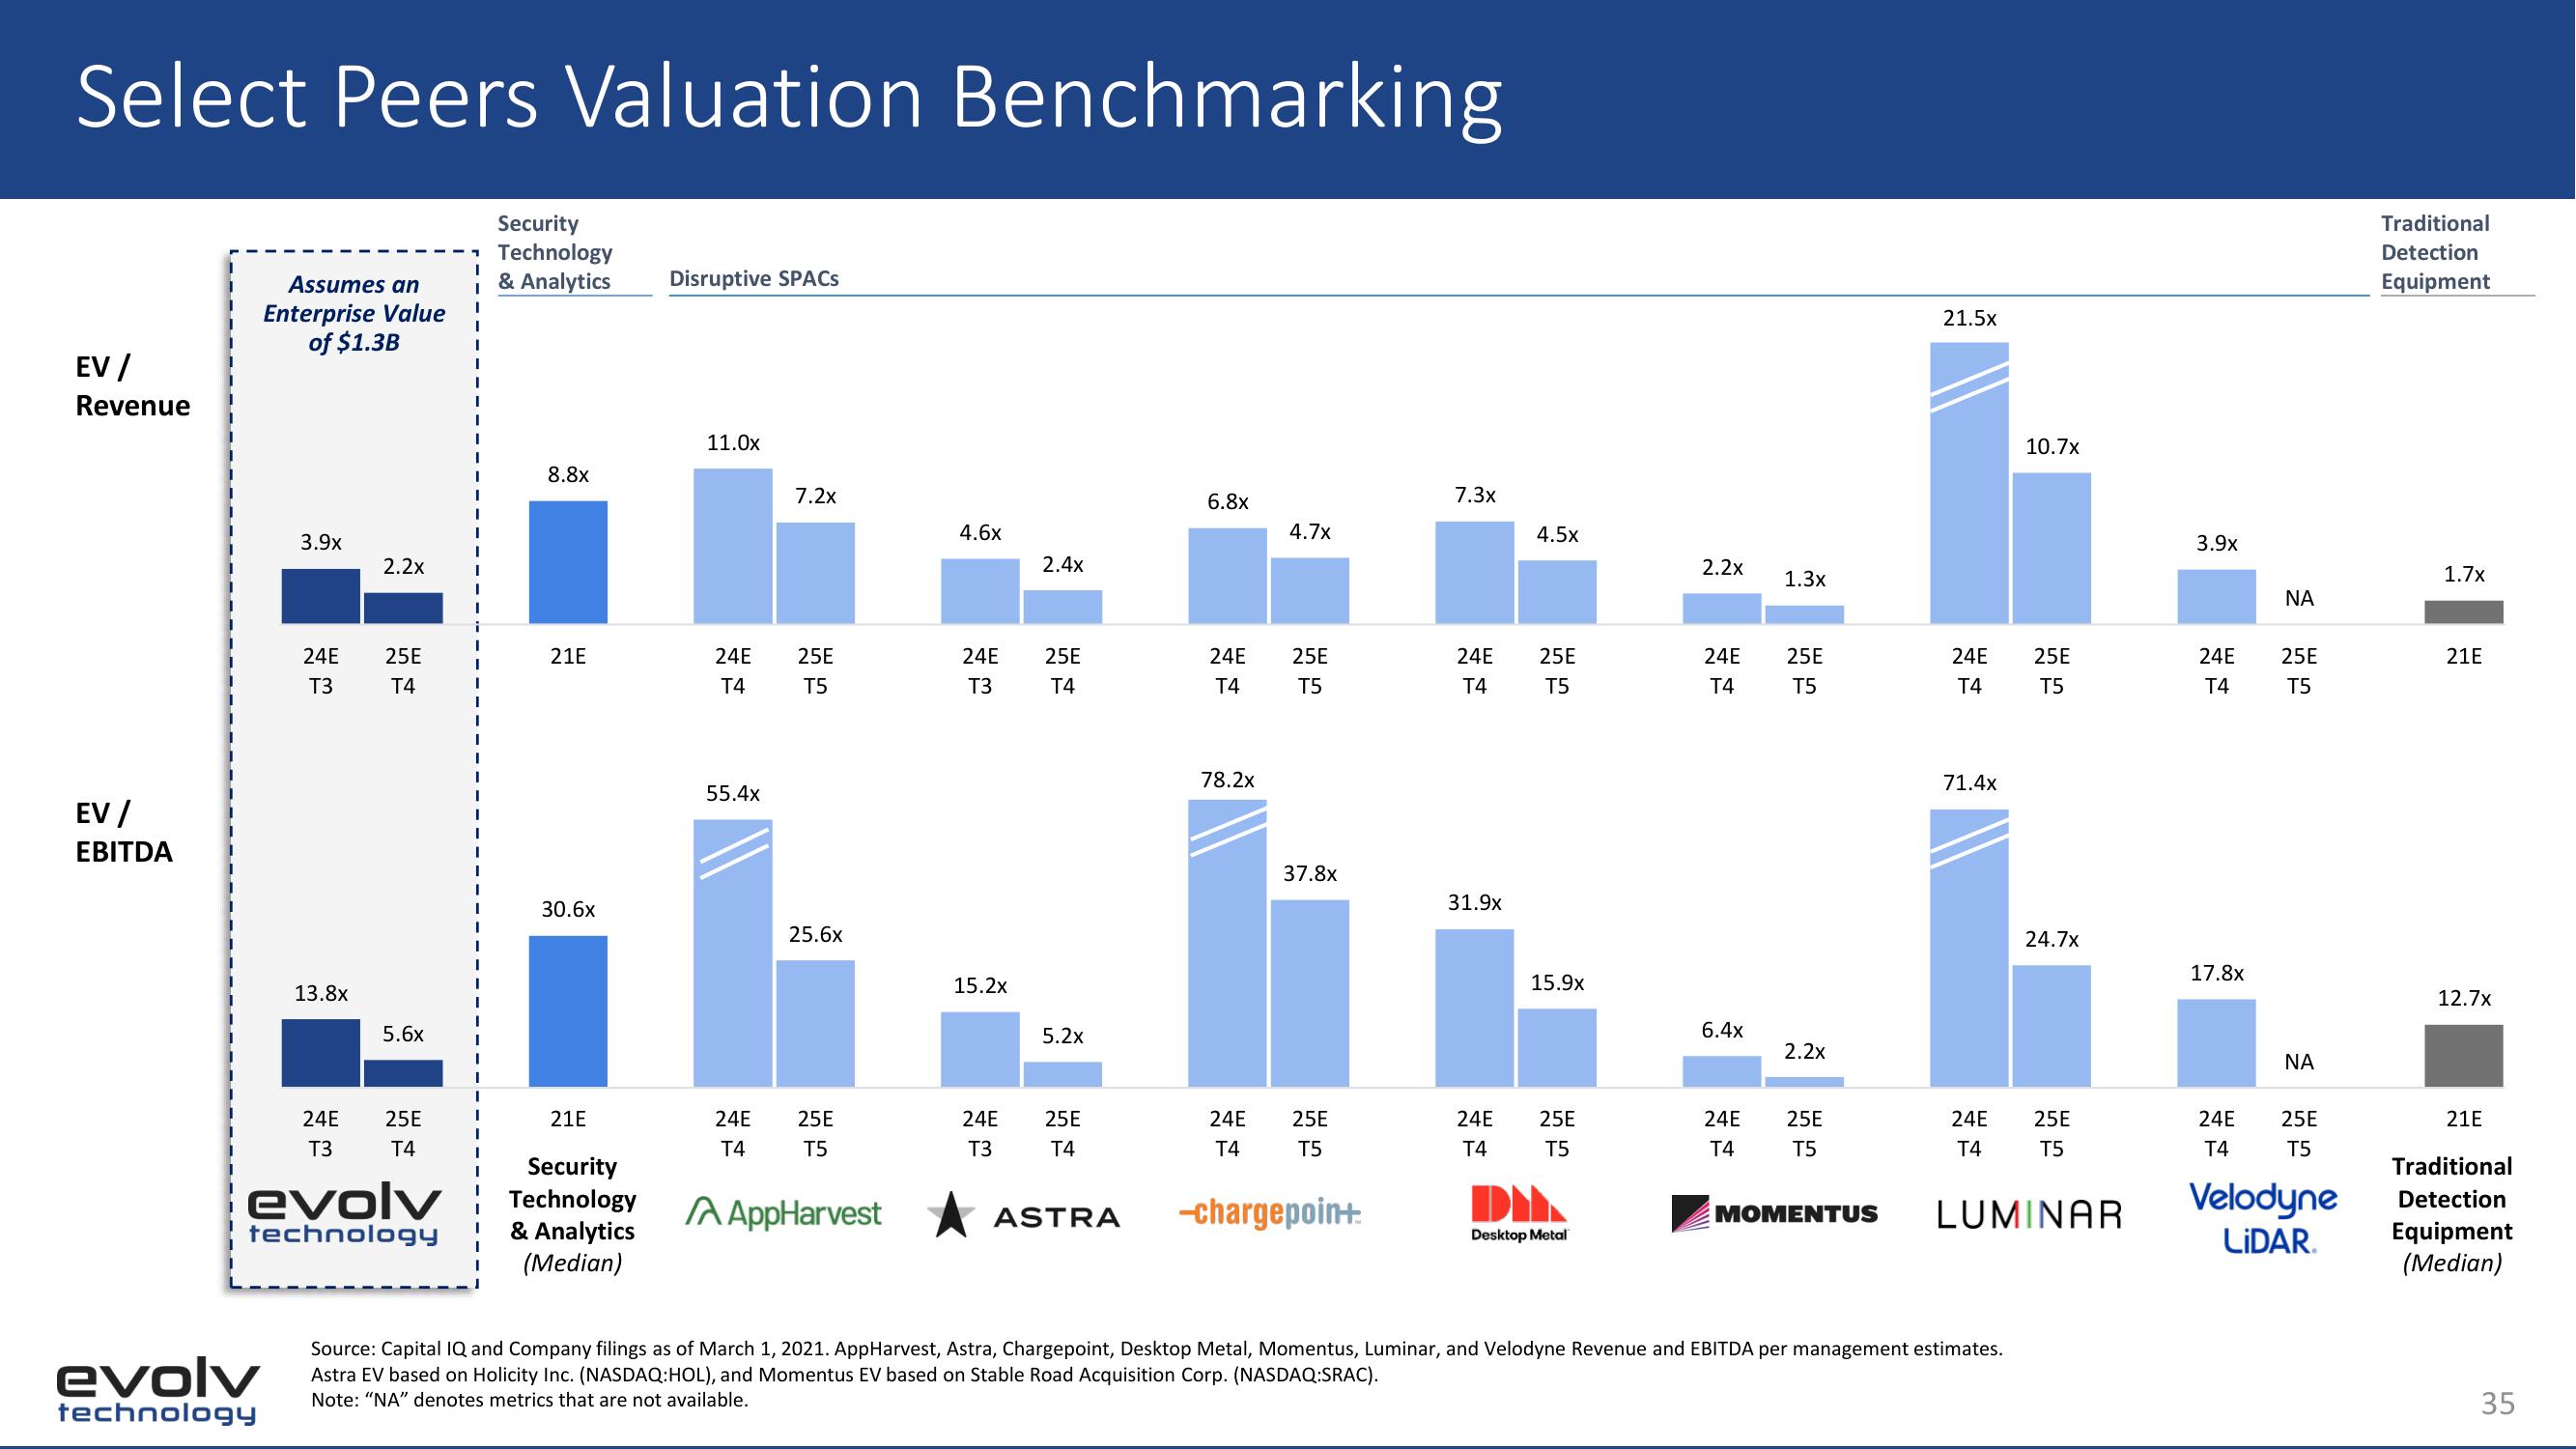
Select Peers Valuation Benchmarking
EV/
Revenue
EV /
EBITDA
Assumes an
Enterprise Value
of $1.3B
evolv
technology
3.9x
24E
T3
13.8x
24E
T3
2.2x
25E
T4
5.6x
25E
T4
evolv
technology
I
I
I
I
I
I
1
I
I
I
1
I
I
I
i
I
1
I
1
I
I
1
I
I
T
I
1
1
I
1
I
1
I
I
I
I
T
I
I
I
1
Security
Technology
& Analytics
8.8x
21E
30.6x
21E
Security
Technology
& Analytics
(Median)
Disruptive SPACS
11.0x
7.2x
24E 25E
T4
T5
55.4x
25.6x
24E 25E
T4
T5
A AppHarvest
4.6x
24E
T3
15.2x
24E
T3
2.4x
25E
T4
5.2x
25E
T4
ASTRA
6.8x
24E
T4
78.2x
24E
T4
4.7x
25E
T5
37.8x
25E
T5
-chargepoin+
7.3x
24E
T4
31.9x
24E
T4
4.5x
25E
T5
15.9x
25E
T5
DI
Desktop Metal
2.2x
24E 25E
T4
T5
6.4x
1.3x
24E
T4
2.2x
25E
T5
MOMENTUS
21.5x
24E
T4
71.4x
24E
T4
10.7:
Source: Capital IQ and Company filings as of March 1, 2021. AppHarvest, Astra, Chargepoint, Desktop Metal, Momentus, Luminar, and Velodyne Revenue and EBITDA per management estimates.
Astra EV based on Holicity Inc. (NASDAQ:HOL), and Momentus EV based on Stable Road Acquisition Corp. (NASDAQ:SRAC).
Note: "NA" denotes metrics that are not available.
25E
T5
25E
T5
LUMINAR
24.7x
3.9x
24E 25E
T4
T5
17.8x
ΝΑ
24E
T4
ΝΑ
25E
T5
Velodyne
LIDAR.
Traditional
Detection
Equipment
1.7x
21E
12.7x
21E
Traditional
Detection
Equipment
(Median)
35View entire presentation