HHR Mergers and Acquisitions Presentation Deck
Key Financial Highlights
hh
17%
Zarplata
84%
2)
27%
3)
HeadHunter
88%
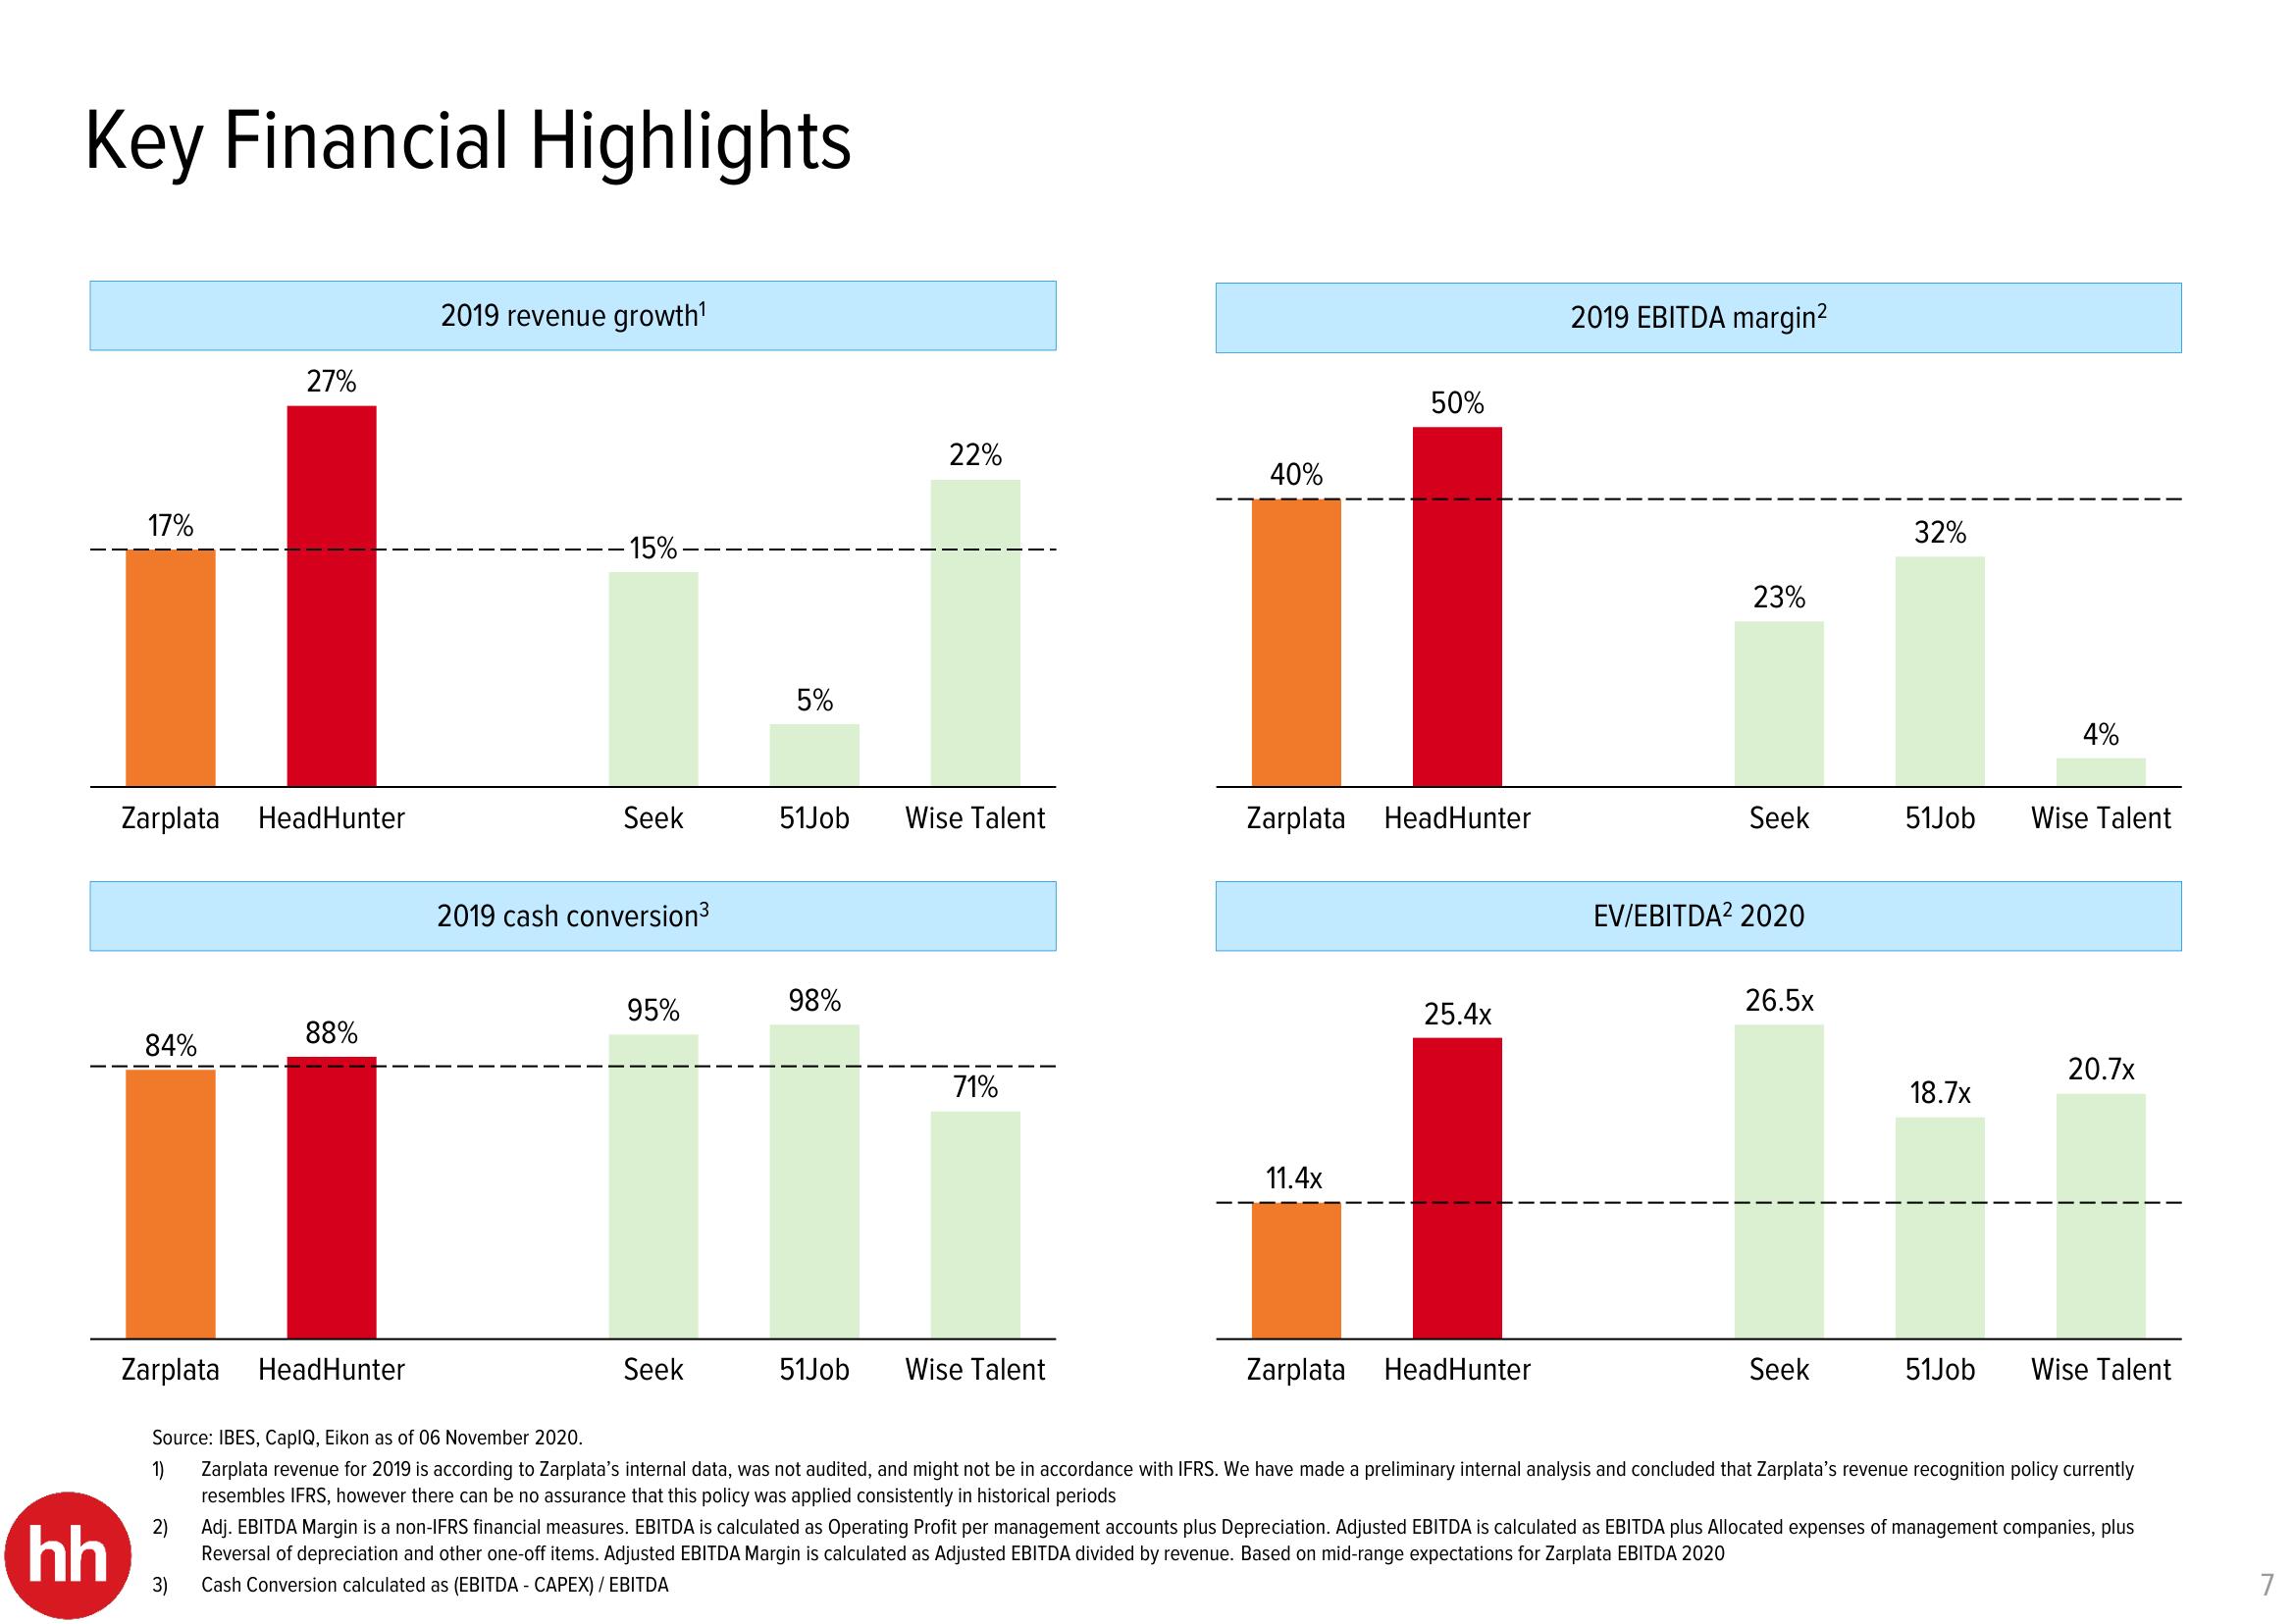
2019 revenue growth¹
-15%-
Seek
2019 cash conversion³
95%
5%
Seek
22%
51Job Wise Talent
98%
71%
40%
51Job Wise Talent
Zarplata HeadHunter
11.4x
50%
Zarplata
25.4x
2019 EBITDA margin²
HeadHunter
23%
Seek
EV/EBITDA² 2020
26.5x
Zarplata HeadHunter
Source: IBES, CapIQ, Eikon as of 06 November 2020.
Zarplata revenue for 2019 is according to Zarplata's internal data, was not audited, and might not be in accordance with IFRS. We have made a preliminary internal analysis and concluded that Zarplata's revenue recognition policy currently
resembles IFRS, however there can be no assurance that this policy was applied consistently in historical periods
1)
32%
Seek
51Job Wise Talent
18.7x
4%
51Job
20.7x
Wise Talent
Adj. EBITDA Margin is a non-IFRS financial measures. EBITDA is calculated as Operating Profit per management accounts plus Depreciation. Adjusted EBITDA is calculated as EBITDA plus Allocated expenses of management companies, plus
Reversal of depreciation and other one-off items. Adjusted EBITDA Margin is calculated as Adjusted EBITDA divided by revenue. Based on mid-range expectations for Zarplata EBITDA 2020
Cash Conversion calculated as (EBITDA - CAPEX) / EBITDA
7View entire presentation