Imperial Brands Results Presentation Deck
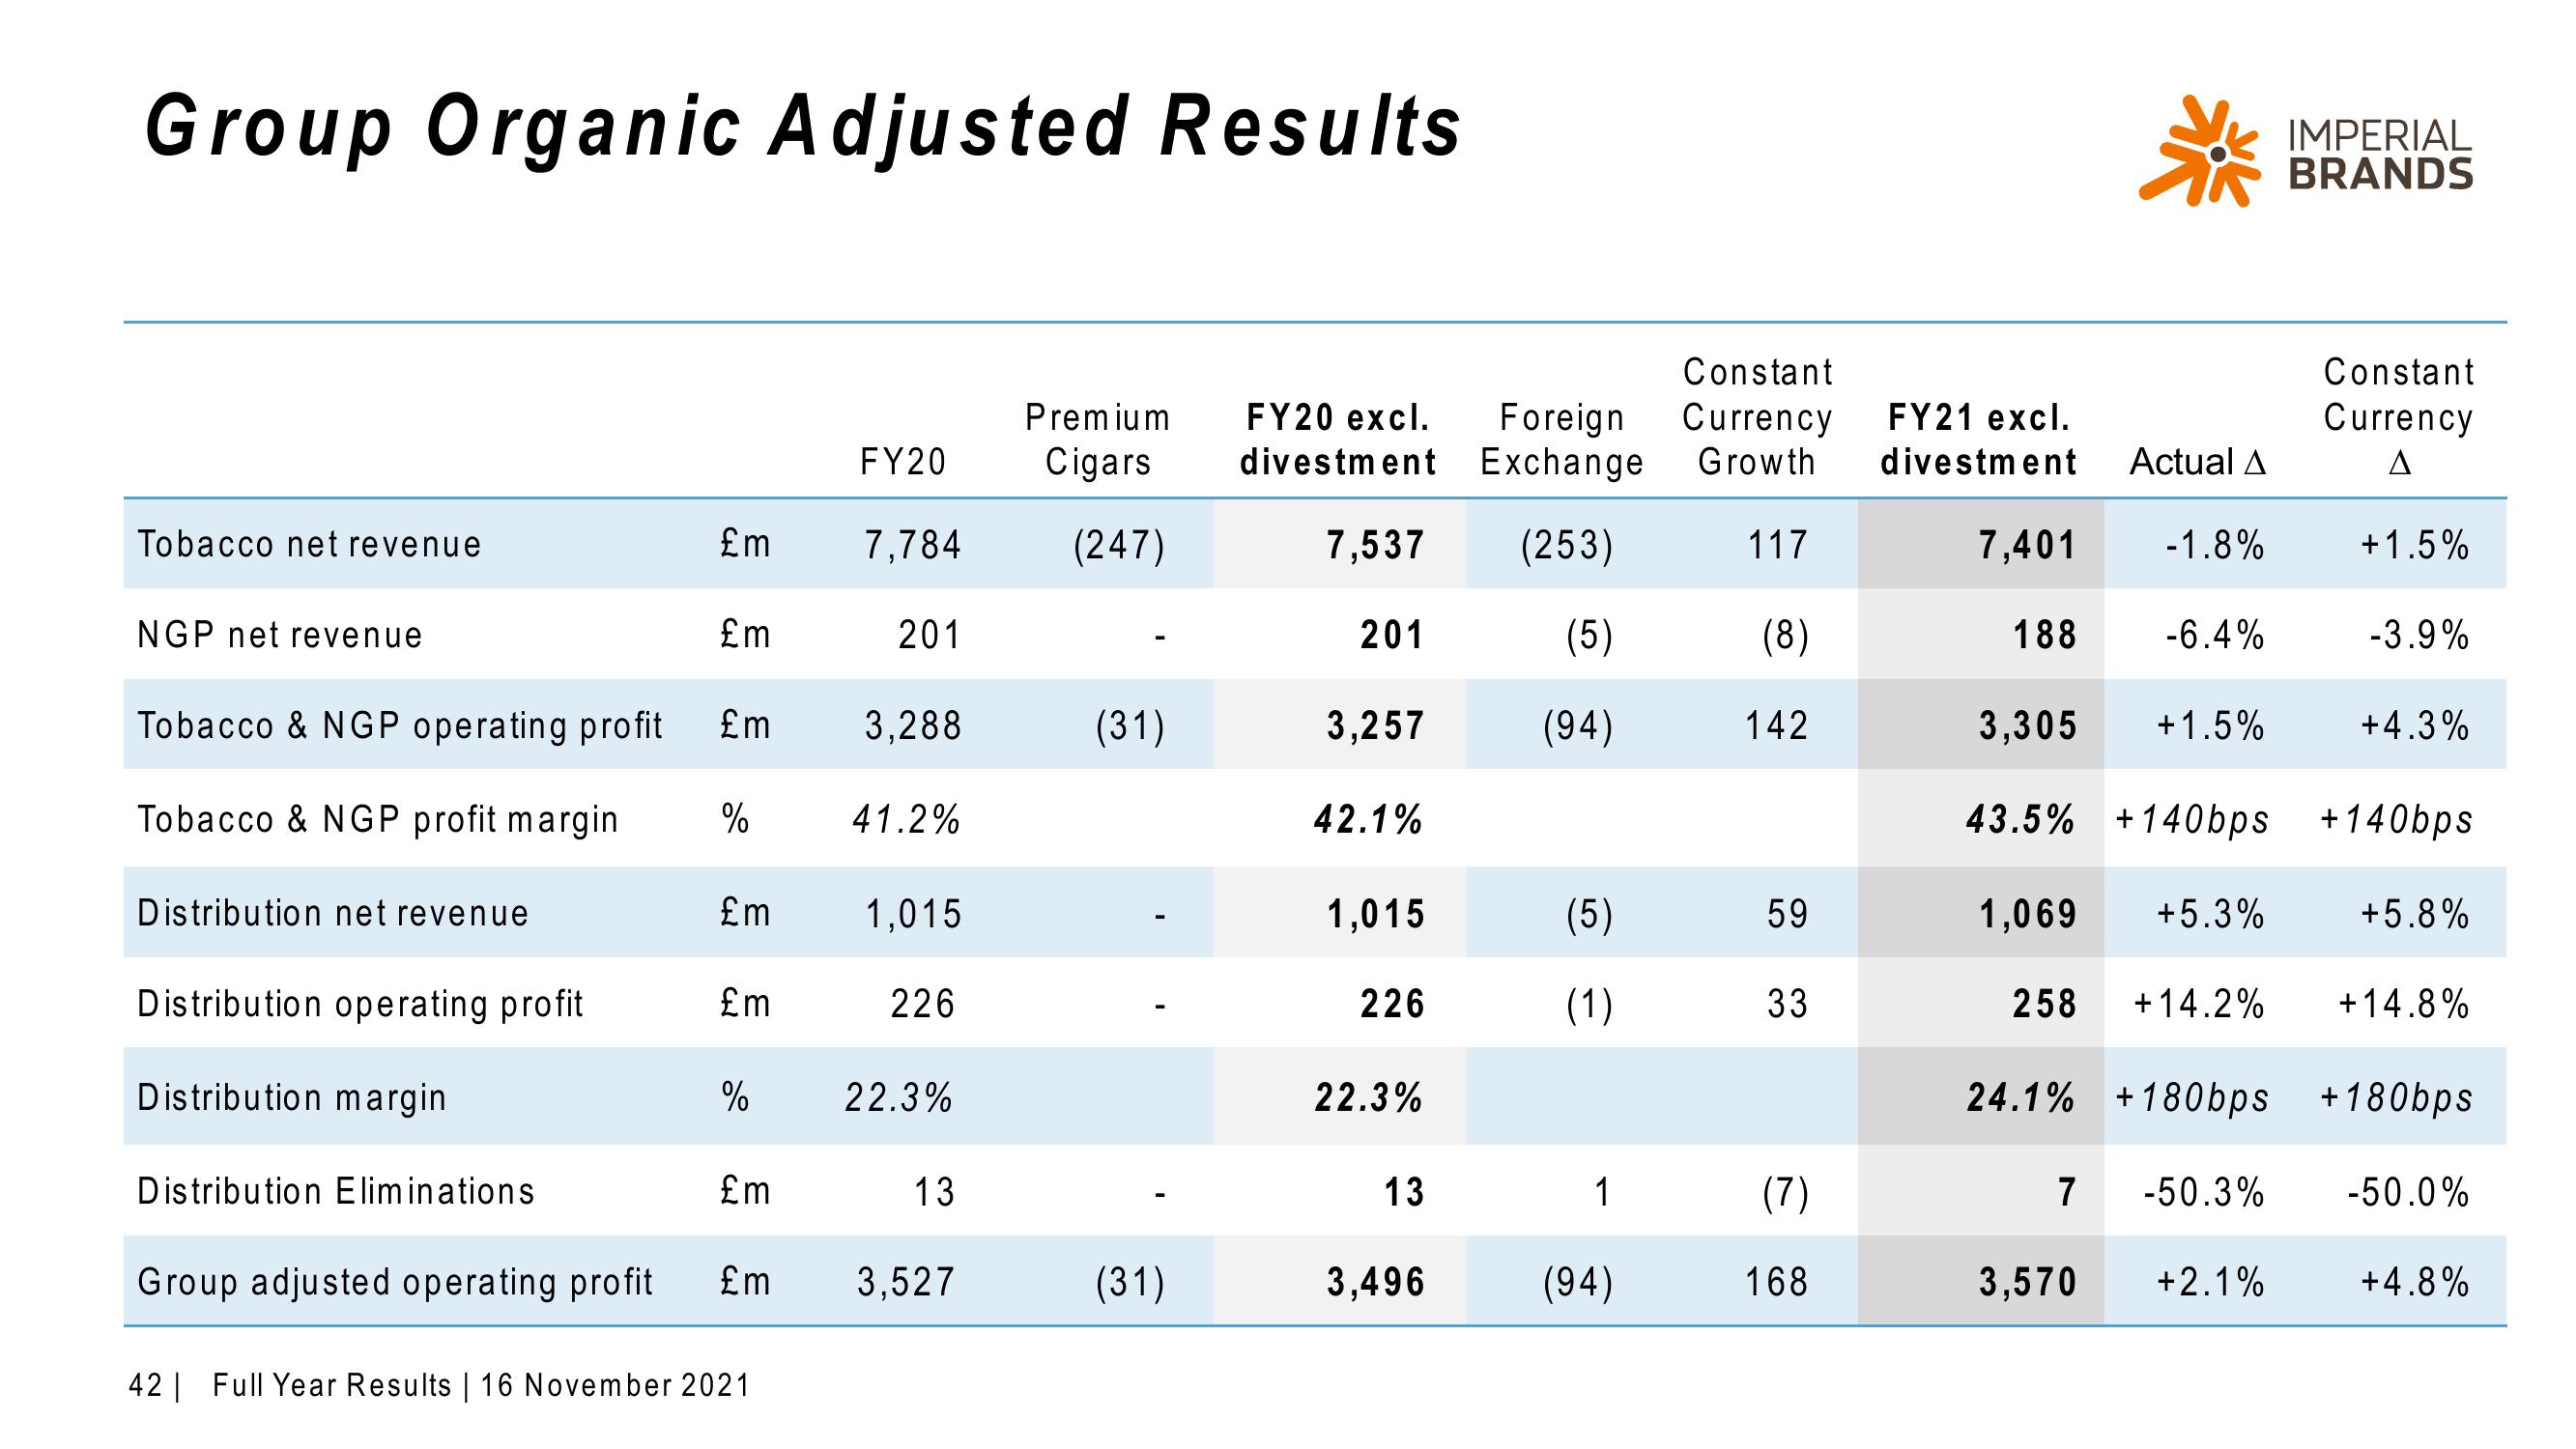
Group Organic Adjusted Results
Tobacco net revenue
NGP net revenue
Tobacco & NGP operating profit
Tobacco & NGP profit margin
Distribution net revenue
Distribution operating profit
Distribution margin
Distribution Eliminations
Group adjusted operating profit
£m
£m
£m
%
£m
£m
%
£m
£m
42 | Full Year Results | 16 November 2021
FY20
7,784
201
3,288
41.2%
1,015
226
22.3%
13
3,527
Constant
Premium FY20 excl. Foreign Currency
Cigars divestment Exchange Growth
(247)
7.537
(253)
117
(5)
(94)
(31)
(31)
201
3,257
42.1%
1,015
226
22.3%
13
3,496
(5)
(1)
1
(94)
(8)
142
59
33
(7)
168
FY21 excl.
divestment
7,401
188
*
Actual A
7
-1.8%
3,570
-6.4%
258 +14.2%
+5.3%
3,305 +1.5%
43.5% +140bps +140bps
1,069
IMPERIAL
BRANDS
-50.3%
Constant
Currency
A
+1.5%
+2.1%
-3.9%
+4.3%
24.1% +180bps +180bps
+5.8%
+14.8%
-50.0%
+4.8%View entire presentation