Comcast Results Presentation Deck
NBCUniversal 3rd Quarter 2021 Overview
Revenue
y/y%
Adj. EBITDA
y/y%
Revenue
$6,333
6
3Q20
$910
+57.9%
3Q20
Adjusted EBITDA ($M)
$10,001
3Q21
+48.2%
($M)
$1,349
3Q21
($M)
Media
Studios
Theme Parks
$6.770
+47.5%
$2,407
+26.8%
$1,449
NM
$997
1.2%
$179
(47.3%)
$434
NM
All percentages represent year/year growth rates.
*Media reported results for 3Q21 include the impacts of the Tokyo Olympics. Refer to Notes page for further details.
See Notes on Slide 11.
Commentary
●
●
●
●
●
●
●
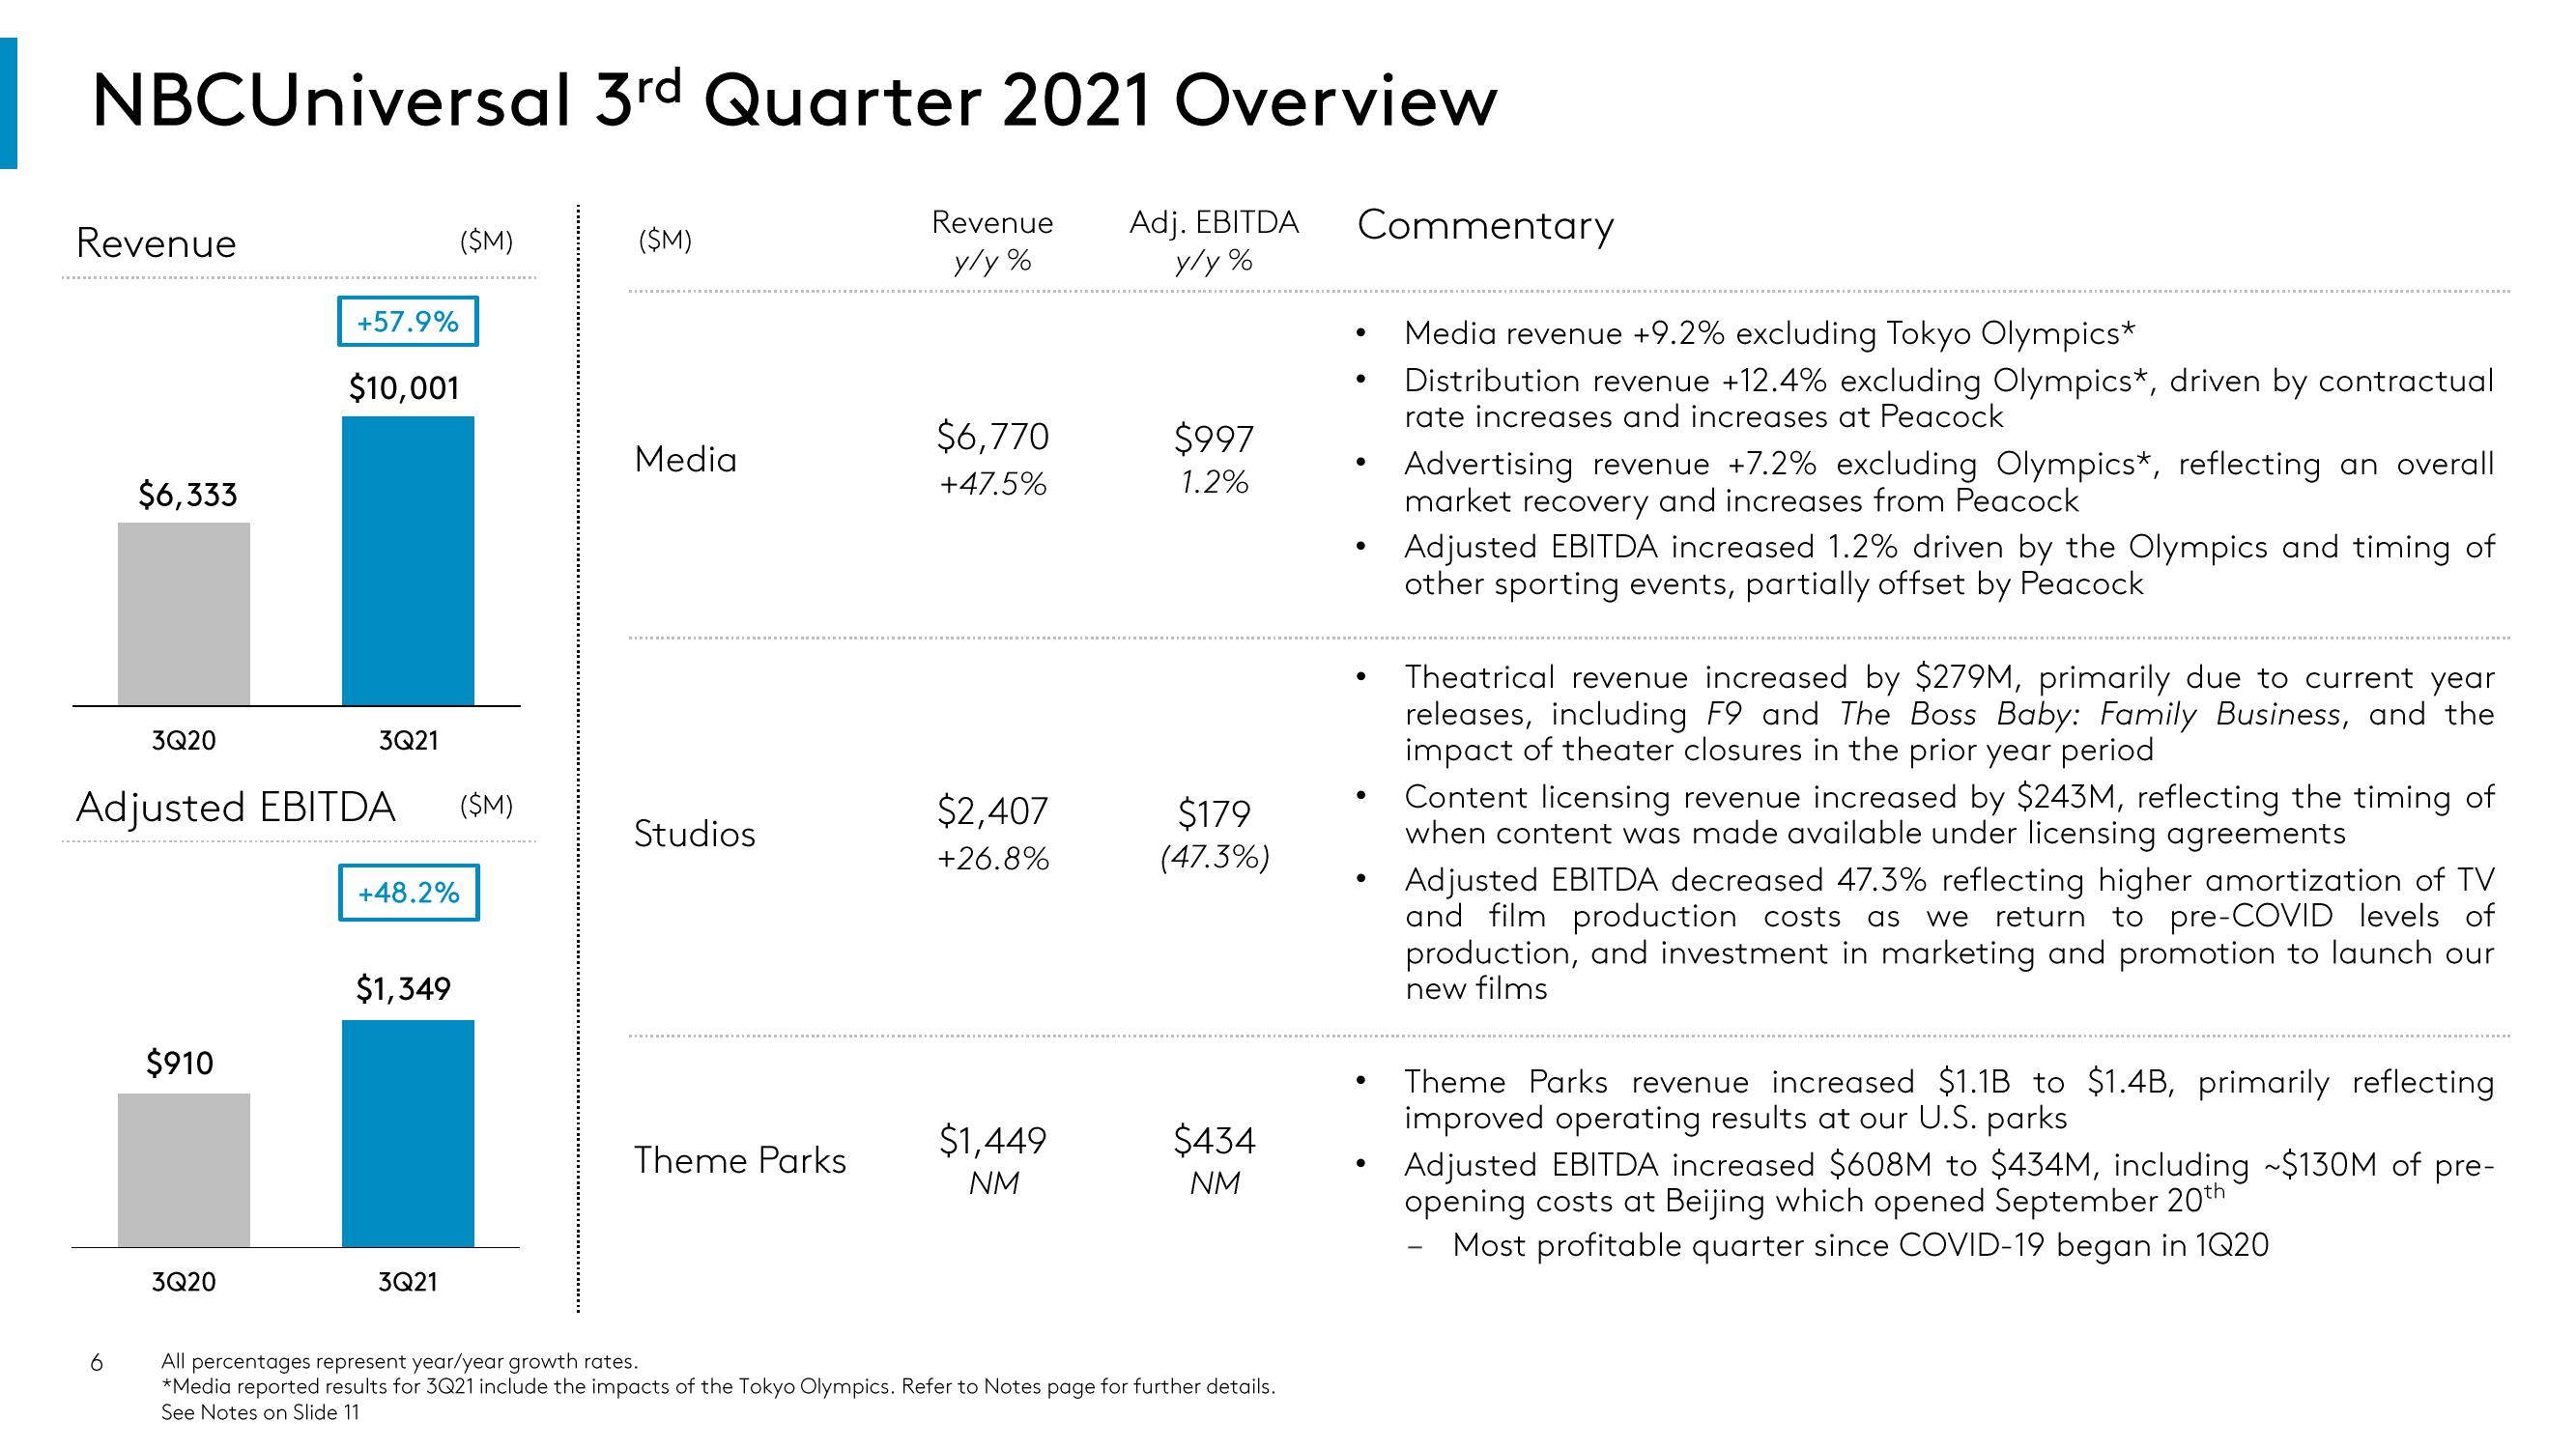
Media revenue +9.2% excluding Tokyo Olympics*
Distribution revenue +12.4% excluding Olympics*, driven by contractual
rate increases and increases at Peacock
Advertising revenue +7.2% excluding Olympics*, reflecting an overall
market recovery and increases from Peacock
Adjusted EBITDA increased 1.2% driven by the Olympics and timing of
other sporting events, partially offset by Peacock
Theatrical revenue increased by $279M, primarily due to current year
releases, including F9 and The Boss Baby: Family Business, and the
impact of theater closures in the prior year period
Content licensing revenue increased by $243M, reflecting the timing of
when content was made available under licensing agreements
Adjusted EBITDA decreased 47.3% reflecting higher amortization of TV
and film production costs as we return to pre-COVID levels of
production, and investment in marketing and promotion to launch our
new films
Theme Parks revenue increased $1.1B to $1.4B, primarily reflecting
improved operating results at our U.S. parks
Adjusted EBITDA increased $608M to $434M, including ~$130M of pre-
opening costs at Beijing which opened September 20th
Most profitable quarter since COVID-19 began in 1Q20View entire presentation