Azure Power Investor Presentation
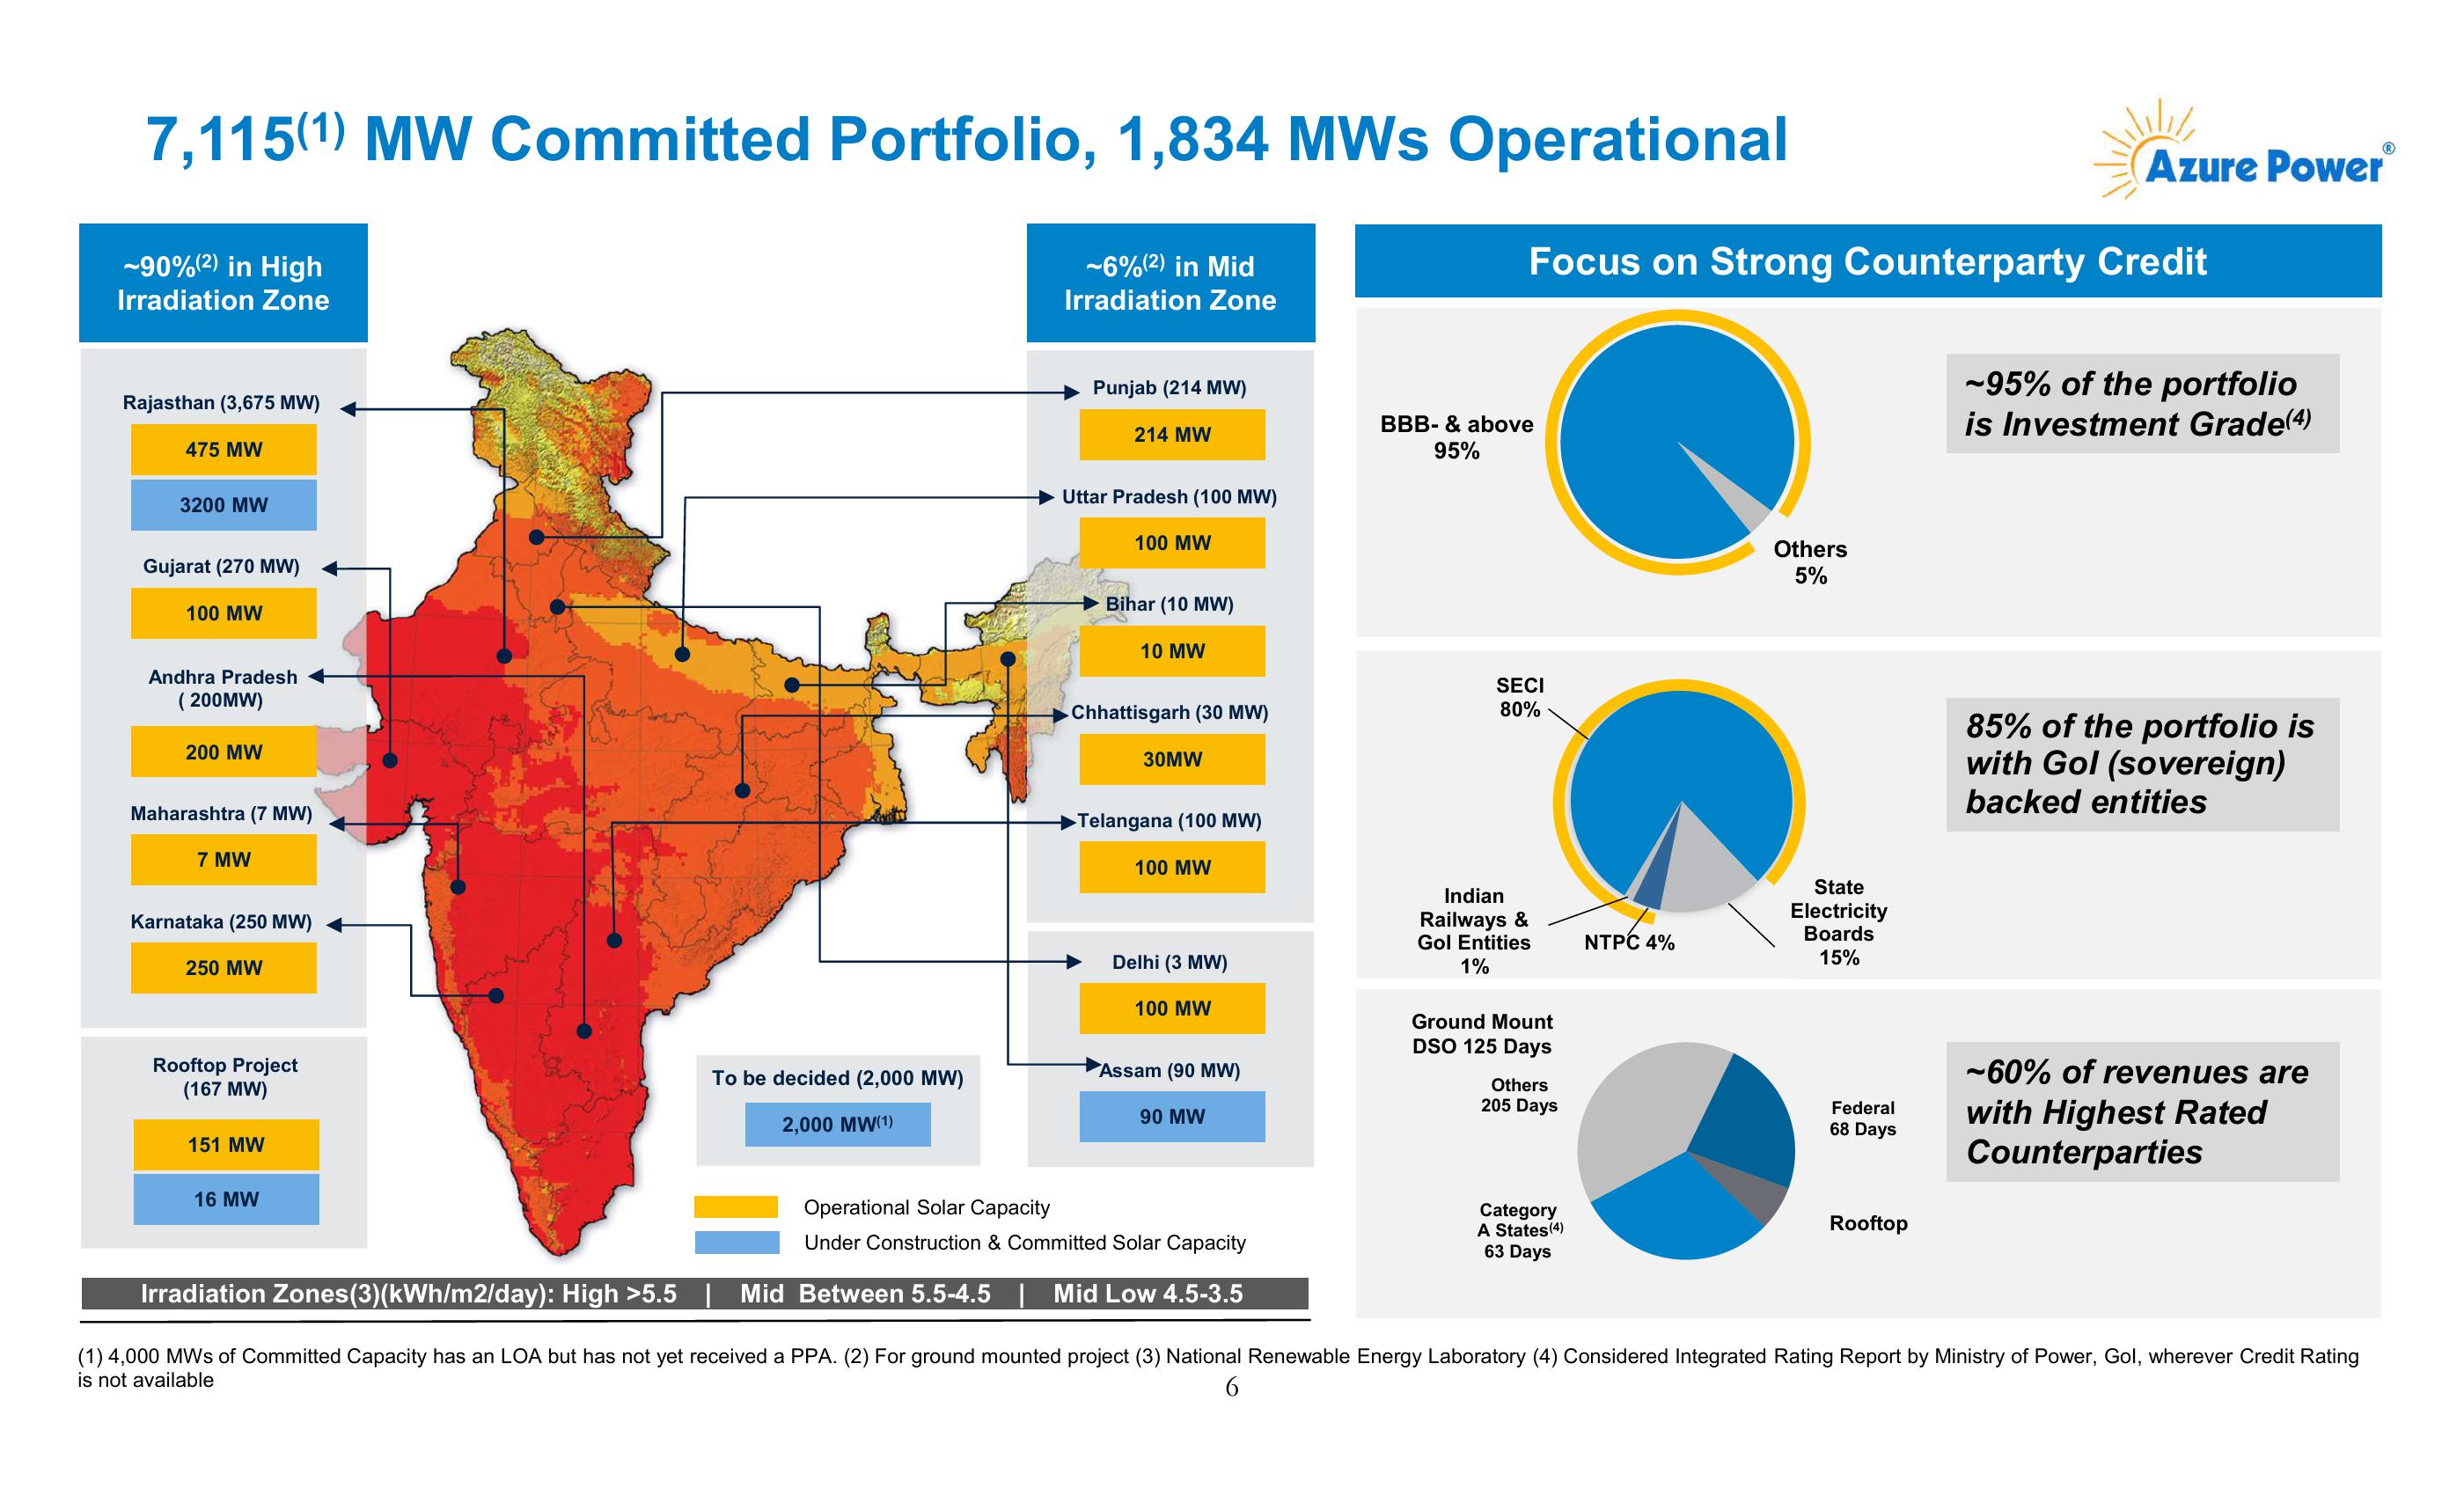
7,115(1) MW Committed Portfolio, 1,834 MWs Operational
~90%(2) in High
Irradiation Zone
Rajasthan (3,675 MW)
475 MW
~6%(2) in Mid
Irradiation Zone
Punjab (214 MW)
214 MW
BBB- & above
95%
Azure Power
Focus on Strong Counterparty Credit
~95% of the portfolio
is Investment Grade(4)
3200 MW
Gujarat (270 MW)
100 MW
Andhra Pradesh
(200MW)
200 MW
Maharashtra (7 MW)
7 MW
Karnataka (250 MW)
250 MW
Rooftop Project
(167 MW)
151 MW
16 MW
Uttar Pradesh (100 MW)
100 MW
Bihar (10 MW)
10 MW
Chhattisgarh (30 MW)
SECI
80%
30MW
Telangana (100 MW)
100 MW
Delhi (3 MW)
100 MW
To be decided (2,000 MW)
Assam (90 MW)
2,000 MW(1)
90 MW
Operational Solar Capacity
Under Construction & Committed Solar Capacity
Indian
Railways &
Gol Entities
1%
NTPC 4%
Others
5%
State
Electricity
Boards
15%
85% of the portfolio is
with Gol (sovereign)
backed entities
Ground Mount
DSO 125 Days
Others
205 Days
Federal
68 Days
~60% of revenues are
with Highest Rated
Counterparties
Category
A States (4)
63 Days
Rooftop
Irradiation Zones (3)(kWh/m2/day): High >5.5 | Mid Between 5.5-4.5 | Mid Low 4.5-3.5
(1) 4,000 MWs of Committed Capacity has an LOA but has not yet received a PPA. (2) For ground mounted project (3) National Renewable Energy Laboratory (4) Considered Integrated Rating Report by Ministry of Power, Gol, wherever Credit Rating
is not available
6View entire presentation