Q3 Fiscal Year 2023 Financial Results
RESULTS REFLECT WEAK ENTERPRISE AND CONSUMER DEMAND
Gaming¹
Video Collaboration
Keyboards & Combos
Pointing Devices
Audio & Wearables
Tablet & Accessories
PC Webcams
Mobile Speakers
Other²
Q3'23 Q3'22
392
226
220
199
69
65
58
38
1
469
287
282
231
104
83
115
57
5
Y/Y
Y/Y (CC)
% of
Total
Sales
31%
(16%) (10%)
(21%) (16%) 18%
(22%)
(17%) 17%
(14%)
(8%)
(34%)
(31%)
(21%) (15%) 5%
(49%) (46%)
(32%)
(29%) 3%
(71%)
(74%) 0%
(22%) (17%) 100%
Net sales
1,270
1,633
1 Gaming includes streaming services revenue generated by Streamlabs.
2 Other includes Smart Home.
3 Market share data through November 2022.
Note: Net sales in $ millions. Comparisons are Y/Y and in US$ unless otherwise specified.
16%
5%
5%
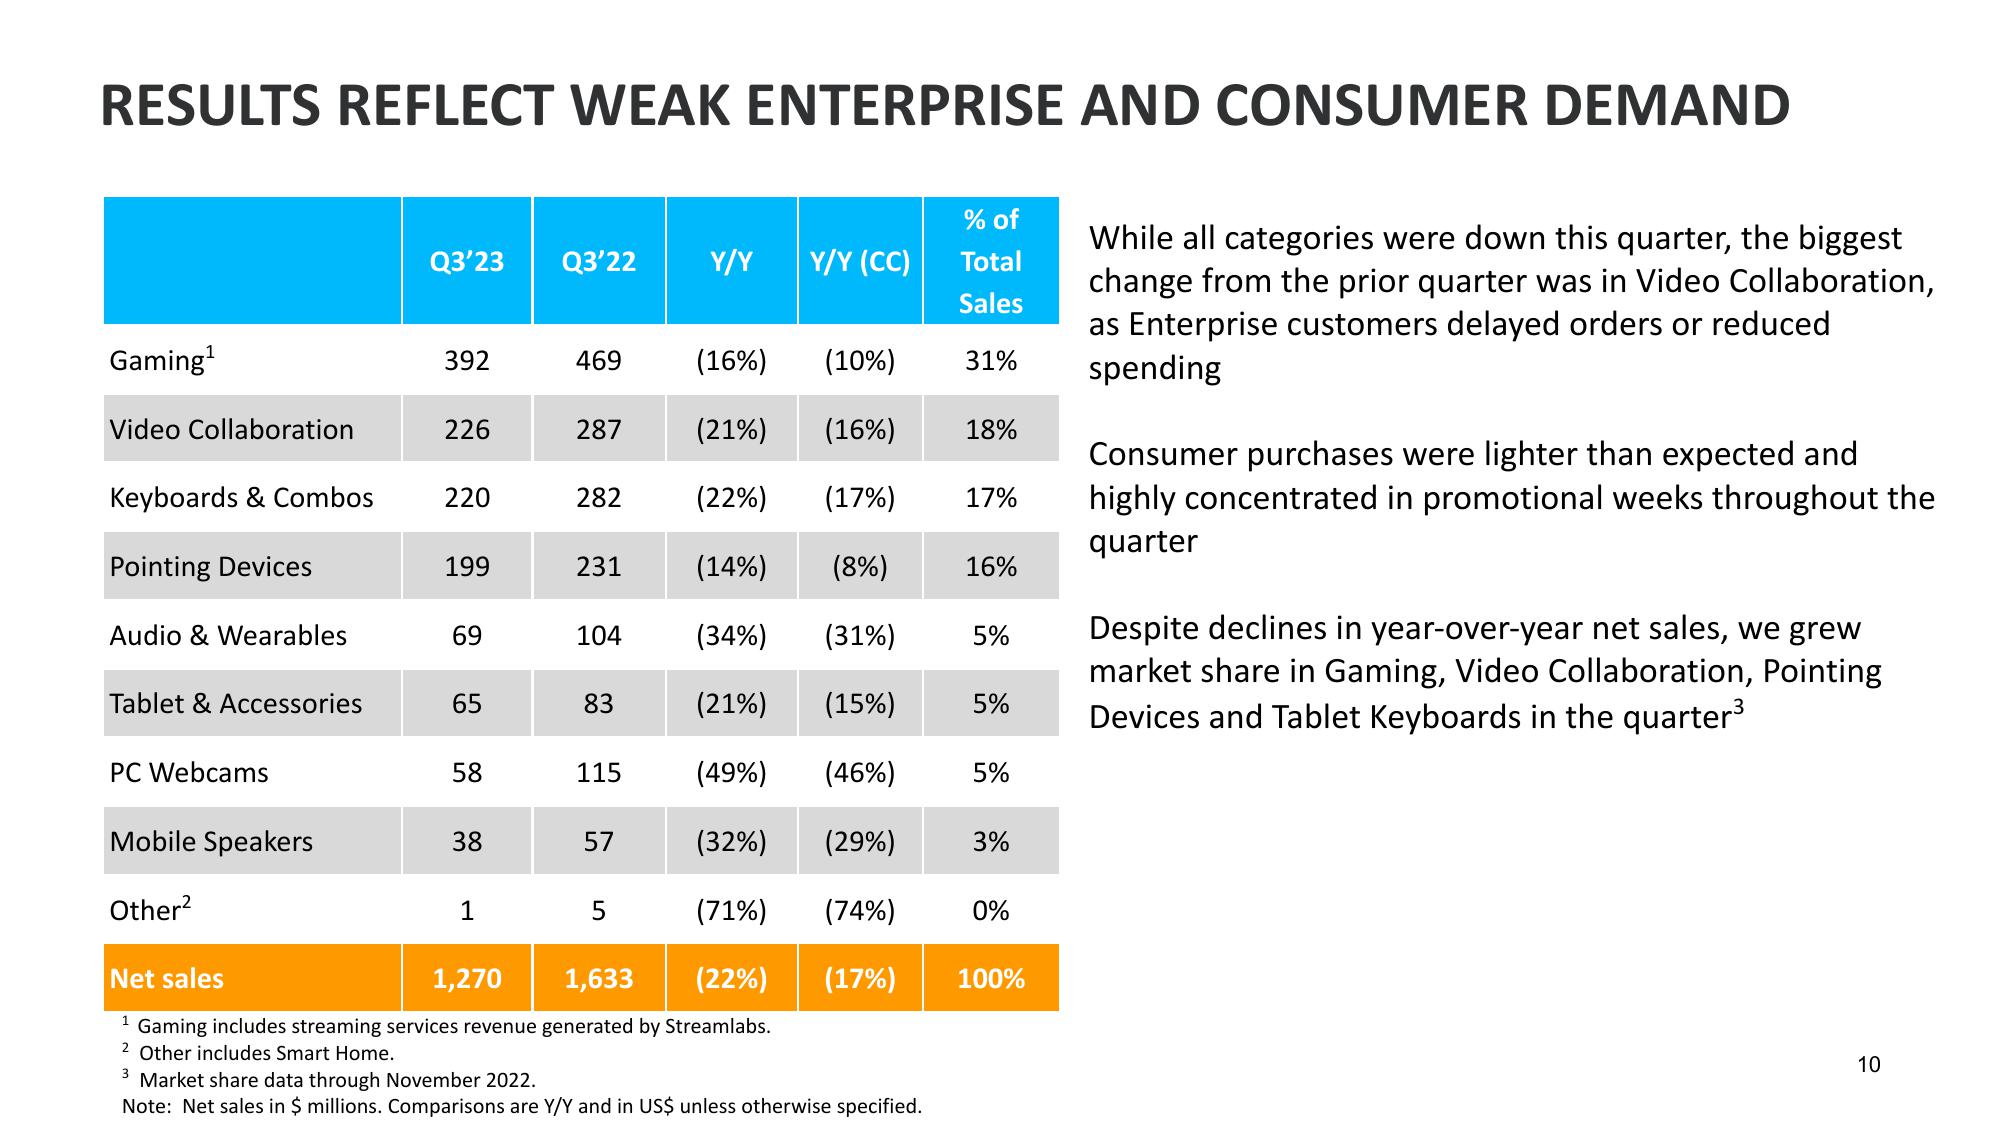
While all categories were down this quarter, the biggest
change from the prior quarter was in Video Collaboration,
as Enterprise customers delayed orders or reduced
spending
Consumer purchases were lighter than expected and
highly concentrated in promotional weeks throughout the
quarter
Despite declines in year-over-year net sales, we grew
market share in Gaming, Video Collaboration, Pointing
Devices and Tablet Keyboards in the quarter³
10View entire presentation