J.P.Morgan Results Presentation Deck
Consumer & Community Banking¹
Selected income statement data ($mm)
Revenue
Banking & Wealth Management²
Home Lending
Card Services & Auto³
Expense
Credit costs
Net charge-offs (NCOs)
Change in allowance
Net income 4
Key drivers / statistics ($B)5
Equity
ROE
Overhead ratio
Average loans
Average deposits
Active mobile customers (mm)6
Debit & credit card sales volume
4Q22
$15,843
9,632
584
5,627
7,981
1,845
845
1,000
$4,542
4Q22
$50.0
35%
50
$448.5
1,142.5
49.7
$411.1
$ 0/(U)
3Q22
$1,512
1,622
(336)
226
(66)
1,316
166
1,150
$208
3Q22
$50.0
33%
56
4Q21
$3,568
3,460
(500)
608
227
2,905
330
2,575
$395
4Q21
$50.0
32%
63
$442.7 $437.7
1,174.2 1,114.3
45.5
48.9
$395.8 $376.2
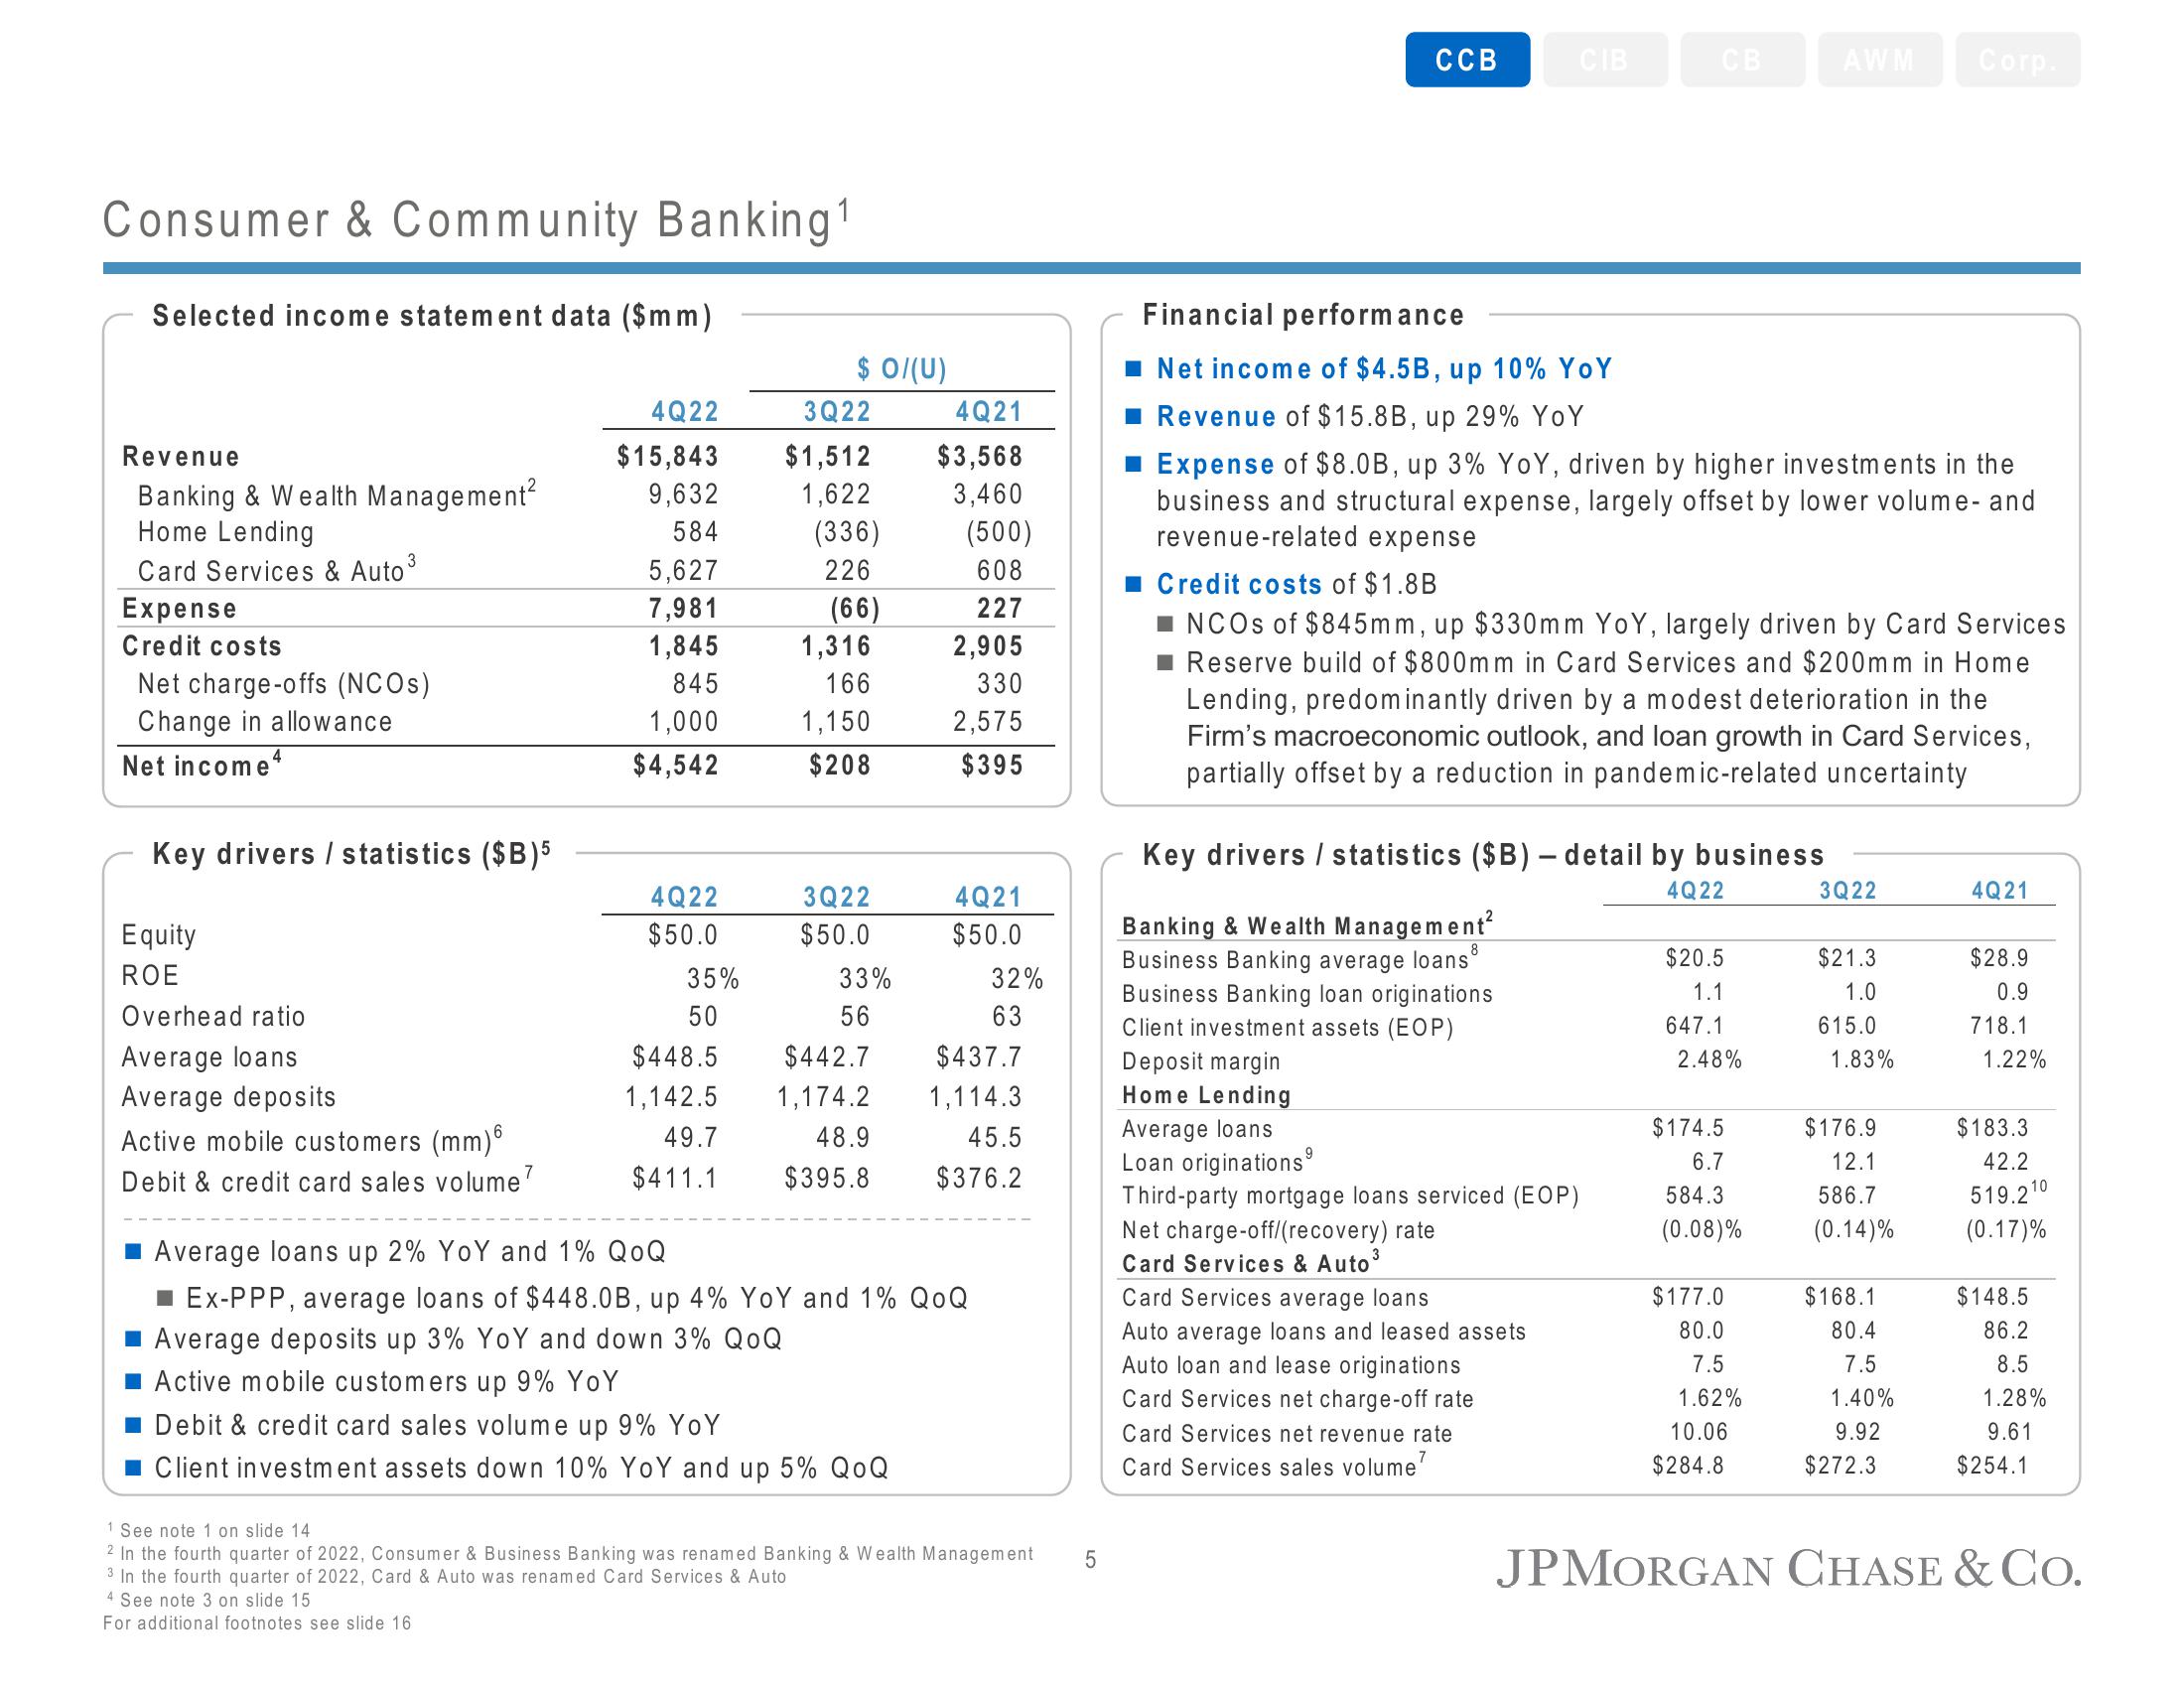
Average loans up 2% YoY and 1% QOQ
■ Ex-PPP, average loans of $448.0B, up 4% YoY and 1% QOQ
Average deposits up 3% YoY and down 3% QOQ
Active mobile customers up 9% YoY
Debit & credit card sales volume up 9% YoY
■ Client investment assets down 10% YoY and up 5% QOQ
1 See note 1 on slide 14
2 In the fourth quarter of 2022, Consumer & Business Banking was renamed Banking & Wealth Management
3 In the fourth quarter of 2022, Card & Auto was renamed Card Services & Auto
4 See note 3 on slide 15
For additional footnotes see slide 16.
5
CCB
CIB
CB
Financial performance
Net income of $4.5B, up 10% YoY
■ Revenue of $15.8B, up 29% YoY
■ Expense of $8.0B, up 3% YoY, driven by higher investments in the
business and structural expense, largely offset by lower volume - and
revenue-related expense
Banking & Wealth Management²
Business Banking average loans
Business Banking loan originations
Client investment assets (EOP)
Deposit margin
Home Lending
Average loans
Loan originations⁹
■ Credit costs of $1.8B
■NCOs of $845mm, up $330mm YoY, largely driven by Card Services
■ Reserve build of $800mm in Card Services and $200mm in Home
Lending, predominantly driven by a modest deterioration in the
Firm's macroeconomic outlook, and loan growth in Card Services,
partially offset by a reduction in pandemic-related uncertainty
Key drivers / statistics ($B) - detail by business
4Q22
Third-party mortgage loans serviced (EOP)
Net charge-off/(recovery) rate
Card Services & Auto³
Card Services average loans
Auto average loans and leased assets
Auto loan and lease originations
Card Services net charge-off rate
Card Services net revenue rate
Card Services sales volume¹
$20.5
1.1
647.1
2.48%
$174.5
6.7
584.3
(0.08)%
AWM Corp.
$177.0
80.0
7.5
1.62%
10.06
$284.8
3Q22
$21.3
1.0
615.0
1.83%
$176.9
12.1
586.7
(0.14)%
$168.1
80.4
7.5
1.40%
9.92
$272.3
4Q21
$28.9
0.9
718.1
1.22%
$183.3
42.2
519.210
(0.17)%
$148.5
86.2
8.5
1.28%
9.61
$254.1
JPMORGAN CHASE & Co.View entire presentation