Netstreit IPO Presentation Deck
2 Portfolio Overview
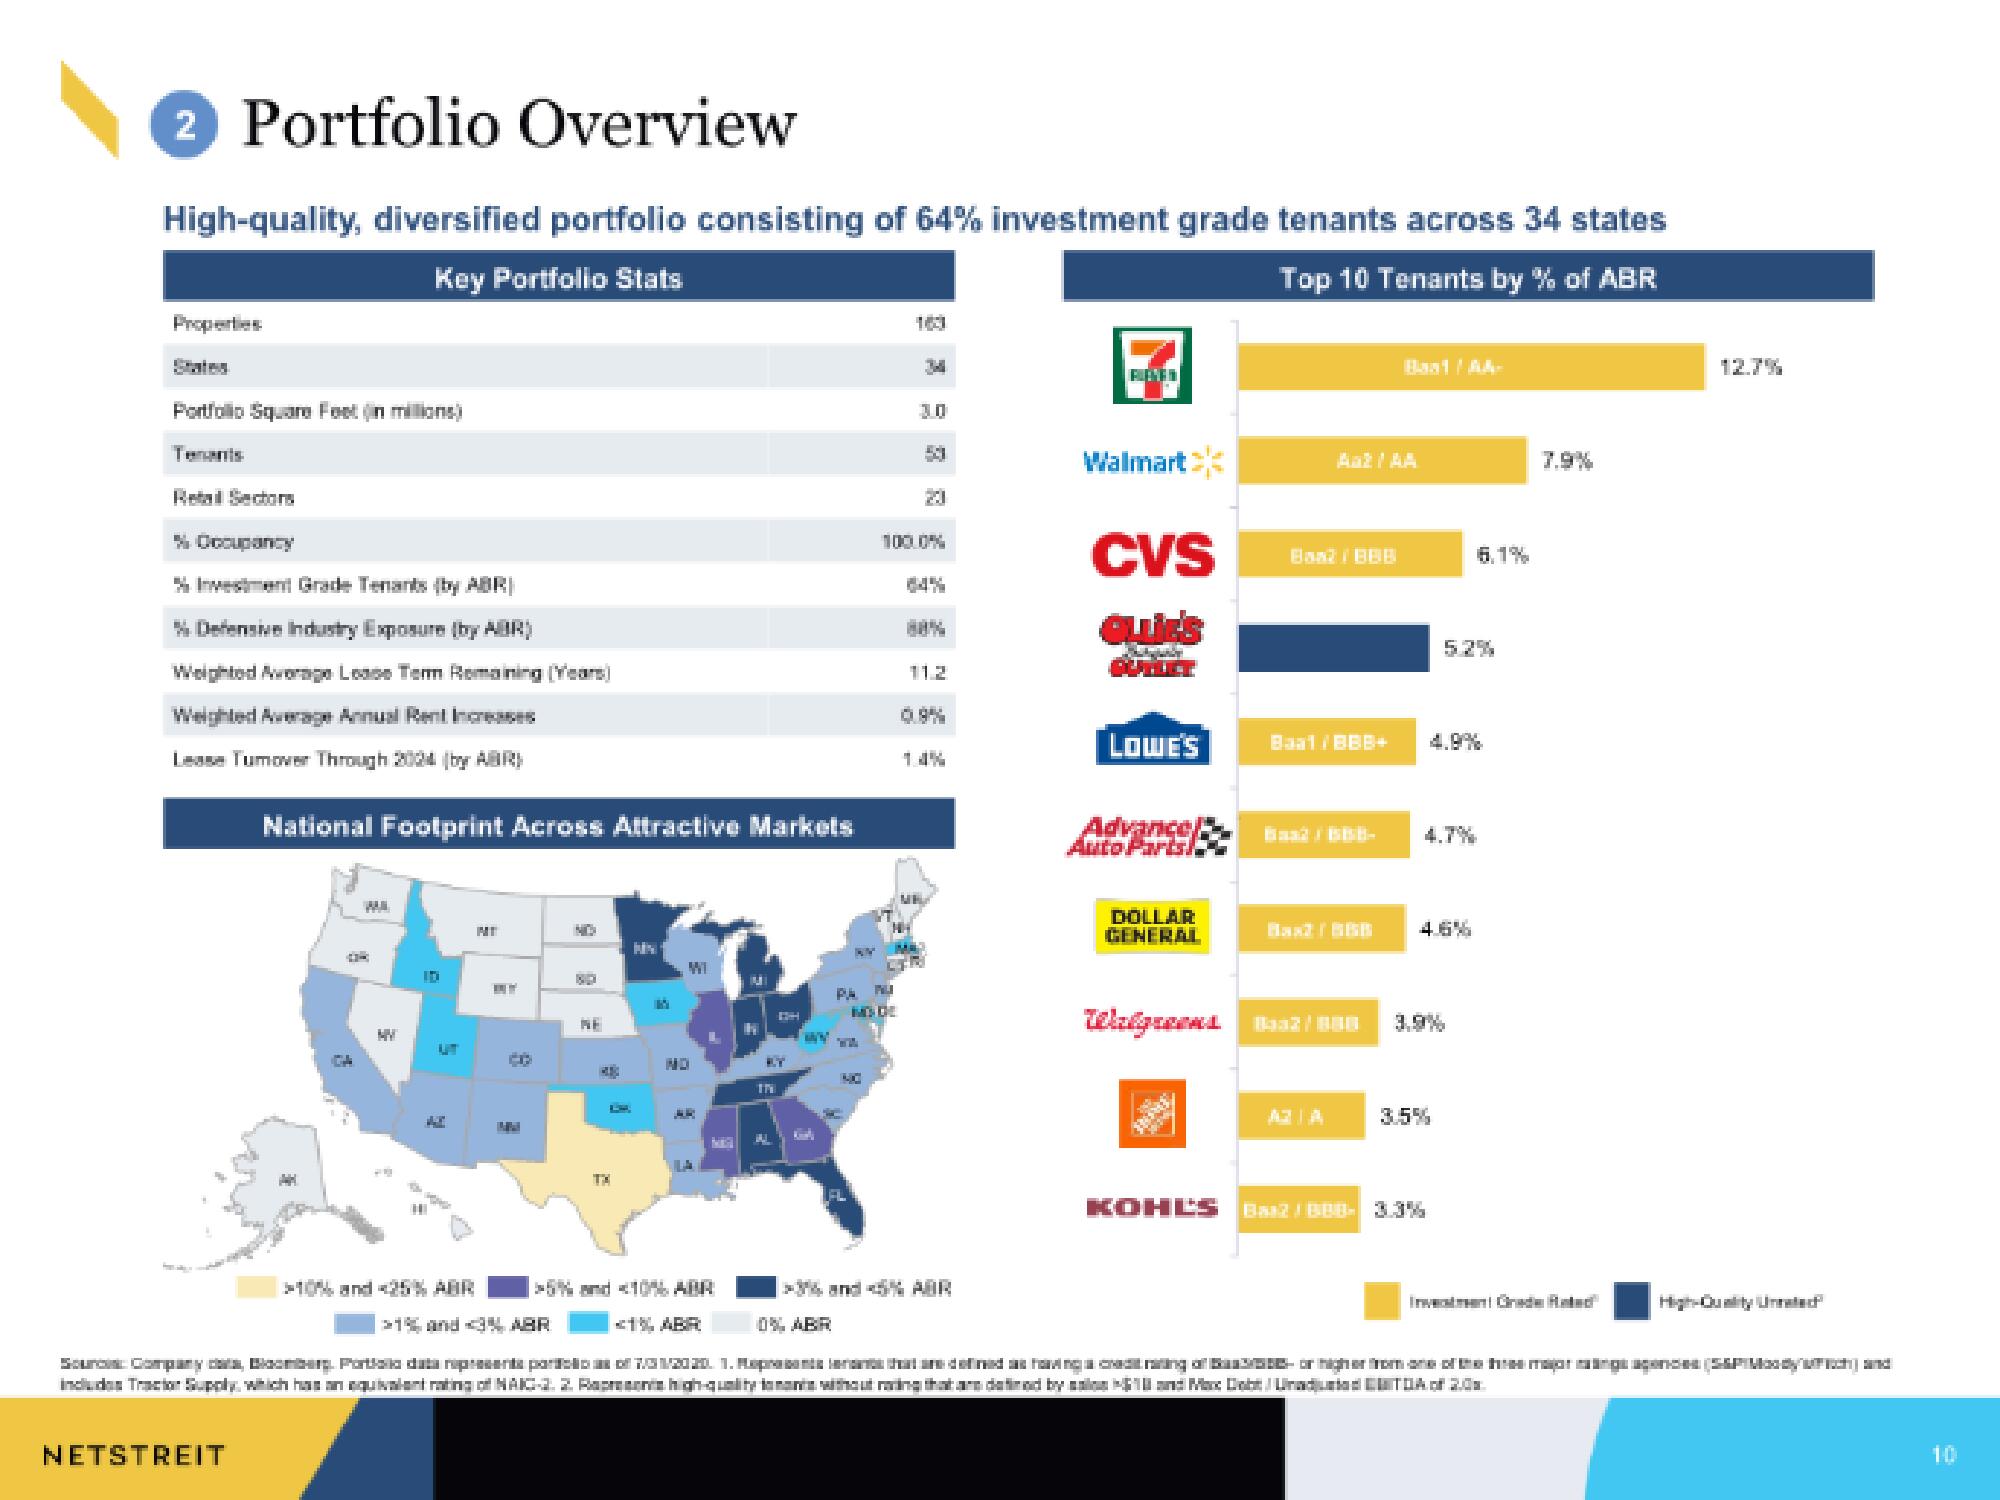
High-quality, diversified portfolio consisting of 64% investment grade tenants across 34 states
Key Portfolio Stats
Top 10 Tenants by % of ABR
Properties
Portfolio Square Feet(in millions)
Tenants
Retail Sectors
% Occupancy
% Investment Grade Tenants (by ABR)
% Defensive Industry Exposure (by ABR)
Weighted Average Lease Tem Remaining (Years)
Weighted Average Annual Rent Increases
Lease Tumover Through 2004 (by ABR)
National Footprint Across Attractive Markets
NETSTREIT
DA
MV
ID
UT
AX
10
MI
Co
NE
48
TX
11
WI
NO
UT
BY
Th
13H
AL
MO
30
PA PU
MODE
100.0%
20
ME
CTR
11.2
FEMEN
Walmart
CVS
LOWE'S
Auto Parts
DOLLAR
GENERAL
Bax?! BBB
Baal/BBB+
Walgreens Baaz / 800
AZIA
4.9%
4.7%
4.6%
KOHLS BZ/BBB- 3.3%
3.5%
7.9%
> and <5% ABR
0% ABR
>5% and <10% ARR
>15 and 3% ABR
<1% ABR
Souros Company, Bloomberg. Portia data representa parti7.01/2020. 1. Poplence that are defined as having a xed rating of Bag303- or higher from one of the three majanganse (S&P Moddychand
Includes Tractor Supply, which has an equivalent rating of NAIG-2. 2. Repreenhigh-quality and without racing that are defined by
and Maxx Debt Urduiad CTO of 2.0
12.7%
Investment Grade Rated
High Quality Unrated
10View entire presentation