Granite Ridge Investor Presentation Deck
●
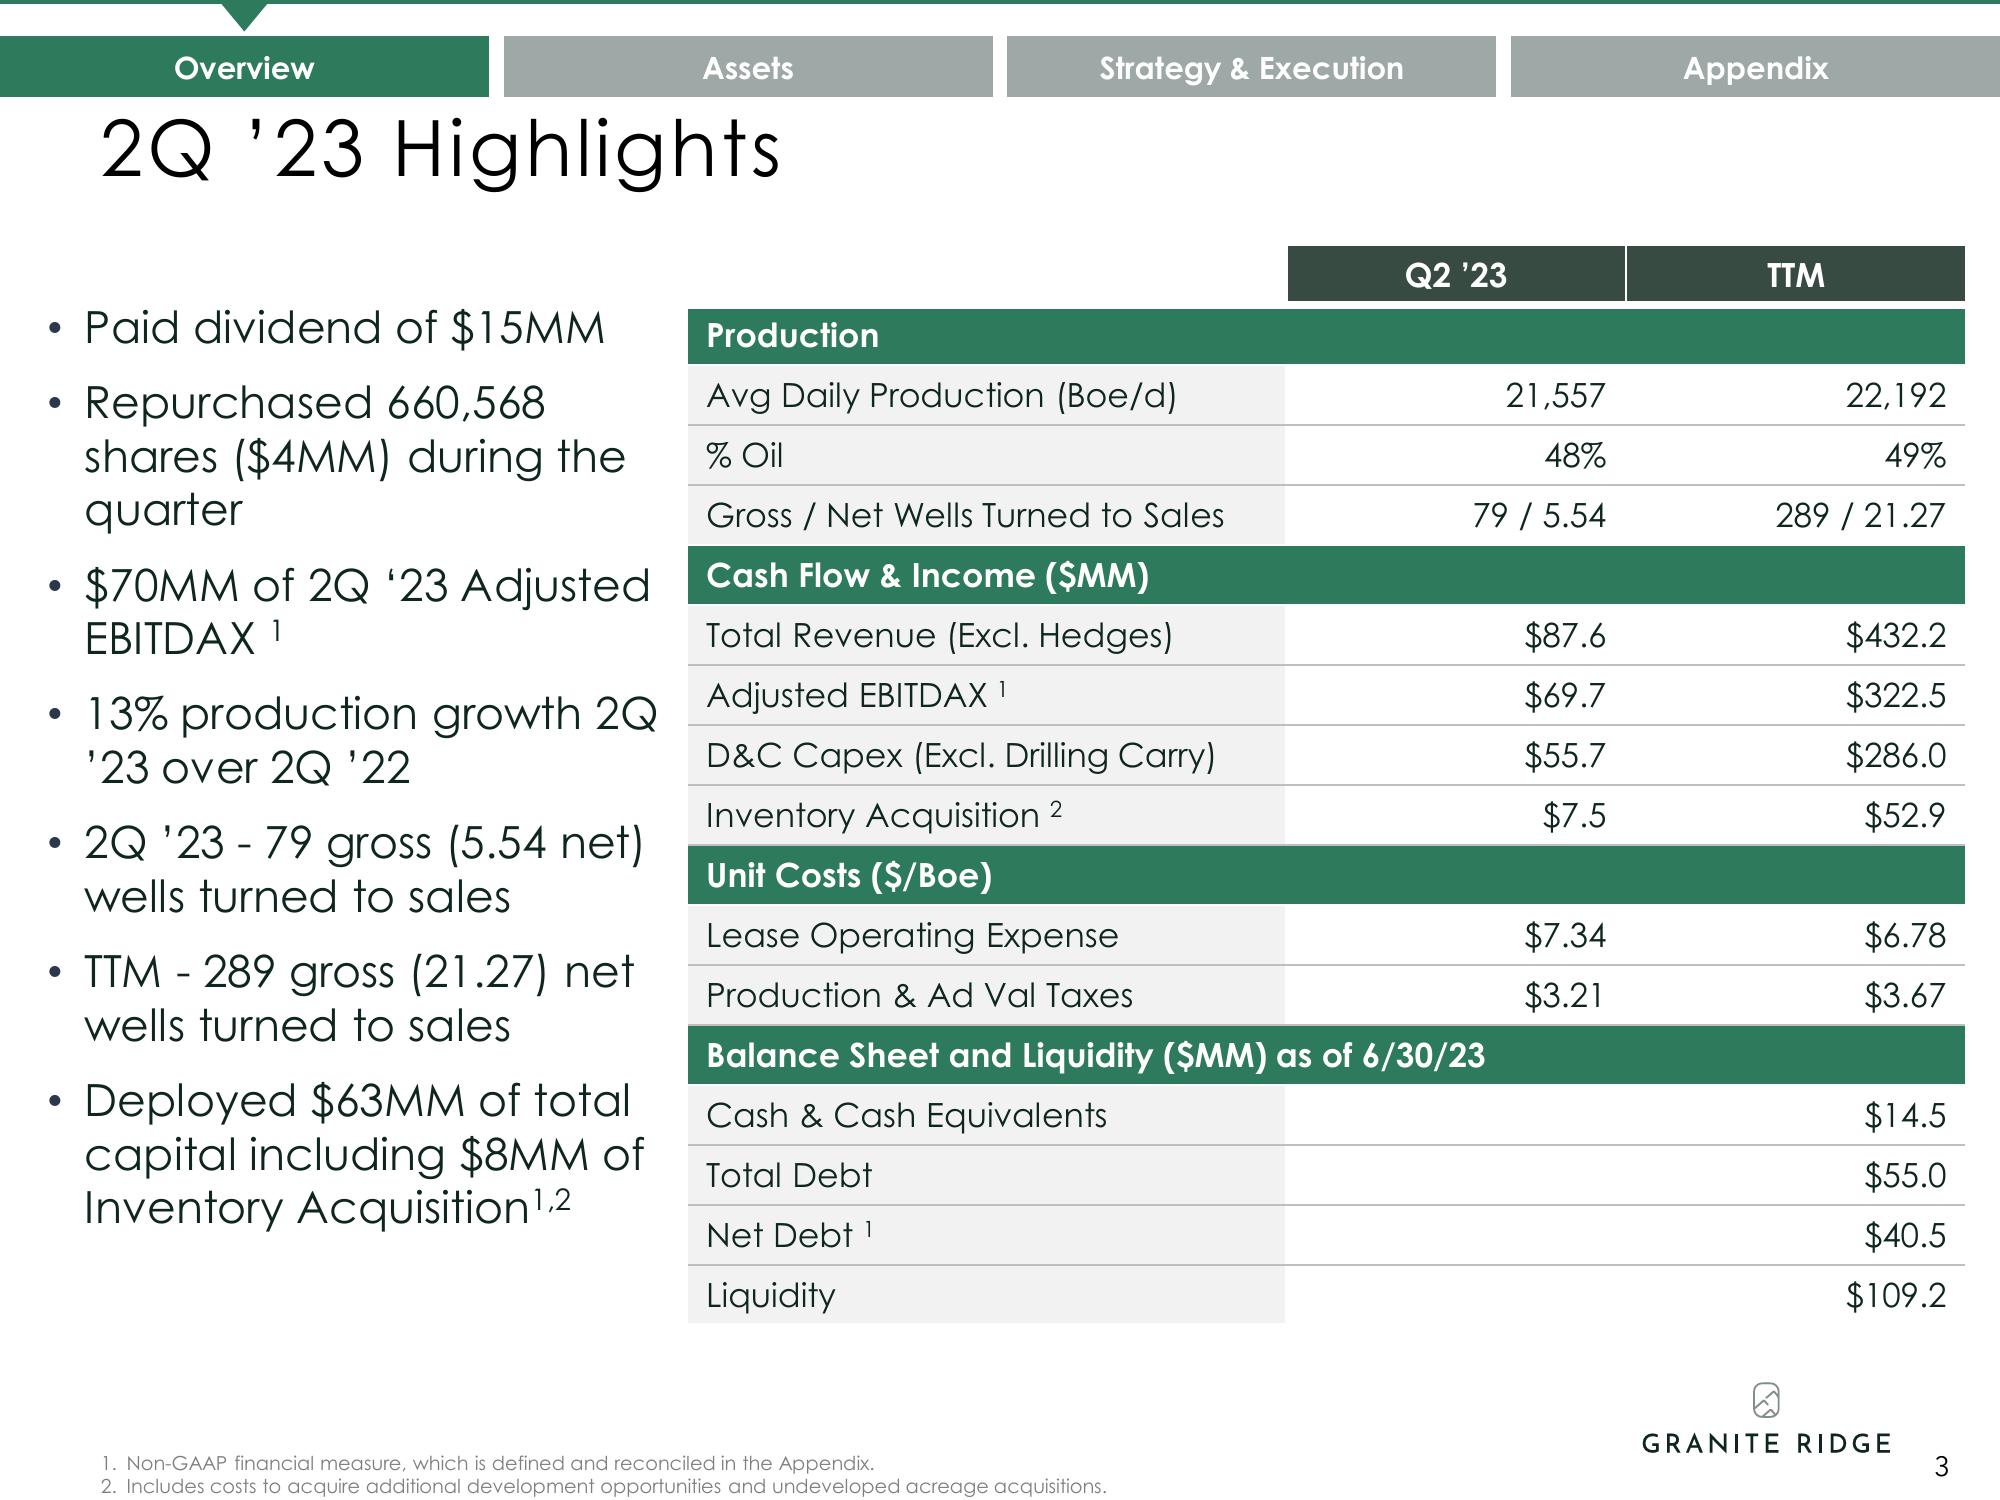
• Paid dividend of $15MM
Repurchased 660,568
shares ($4MM) during the
quarter
●
●
●
Overview
●
2Q '23 Highlights
$70MM of 2Q '23 Adjusted
EBITDAX 1
2Q '23 - 79 gross (5.54 net)
wells turned to sales
Assets
TTM - 289 gross (21.27) net
wells turned to sales
13% production growth 2Q Adjusted EBITDAX
'23 over 2Q '22
Deployed $63MM of total
capital including $8MM of
Inventory Acquisition 1¹.2
Strategy & Execution
Production
Avg Daily Production (Boe/d)
% Oil
Gross / Net Wells Turned to Sales
Cash Flow & Income ($MM)
Total Revenue (Excl. Hedges)
¹
Q2 '23
1. Non-GAAP financial measure, which is defined and reconciled in the Appendix.
2. Includes costs to acquire additional development opportunities and undeveloped acreage acquisitions.
21,557
48%
79 / 5.54
D&C Capex (Excl. Drilling Carry)
2
Inventory Acquisition
Unit Costs ($/Boe)
Lease Operating Expense
Production & Ad Val Taxes
Balance Sheet and Liquidity ($MM) as of 6/30/23
Cash & Cash Equivalents
Total Debt
Net Debt ¹
Liquidity
$87.6
$69.7
$55.7
$7.5
$7.34
$3.21
Appendix
TTM
22,192
49%
289 / 21.27
$432.2
$322.5
$286.0
$52.9
$6.78
$3.67
$14.5
$55.0
$40.5
$109.2
GRANITE RIDGE
3View entire presentation