HHR Investor Presentation Deck
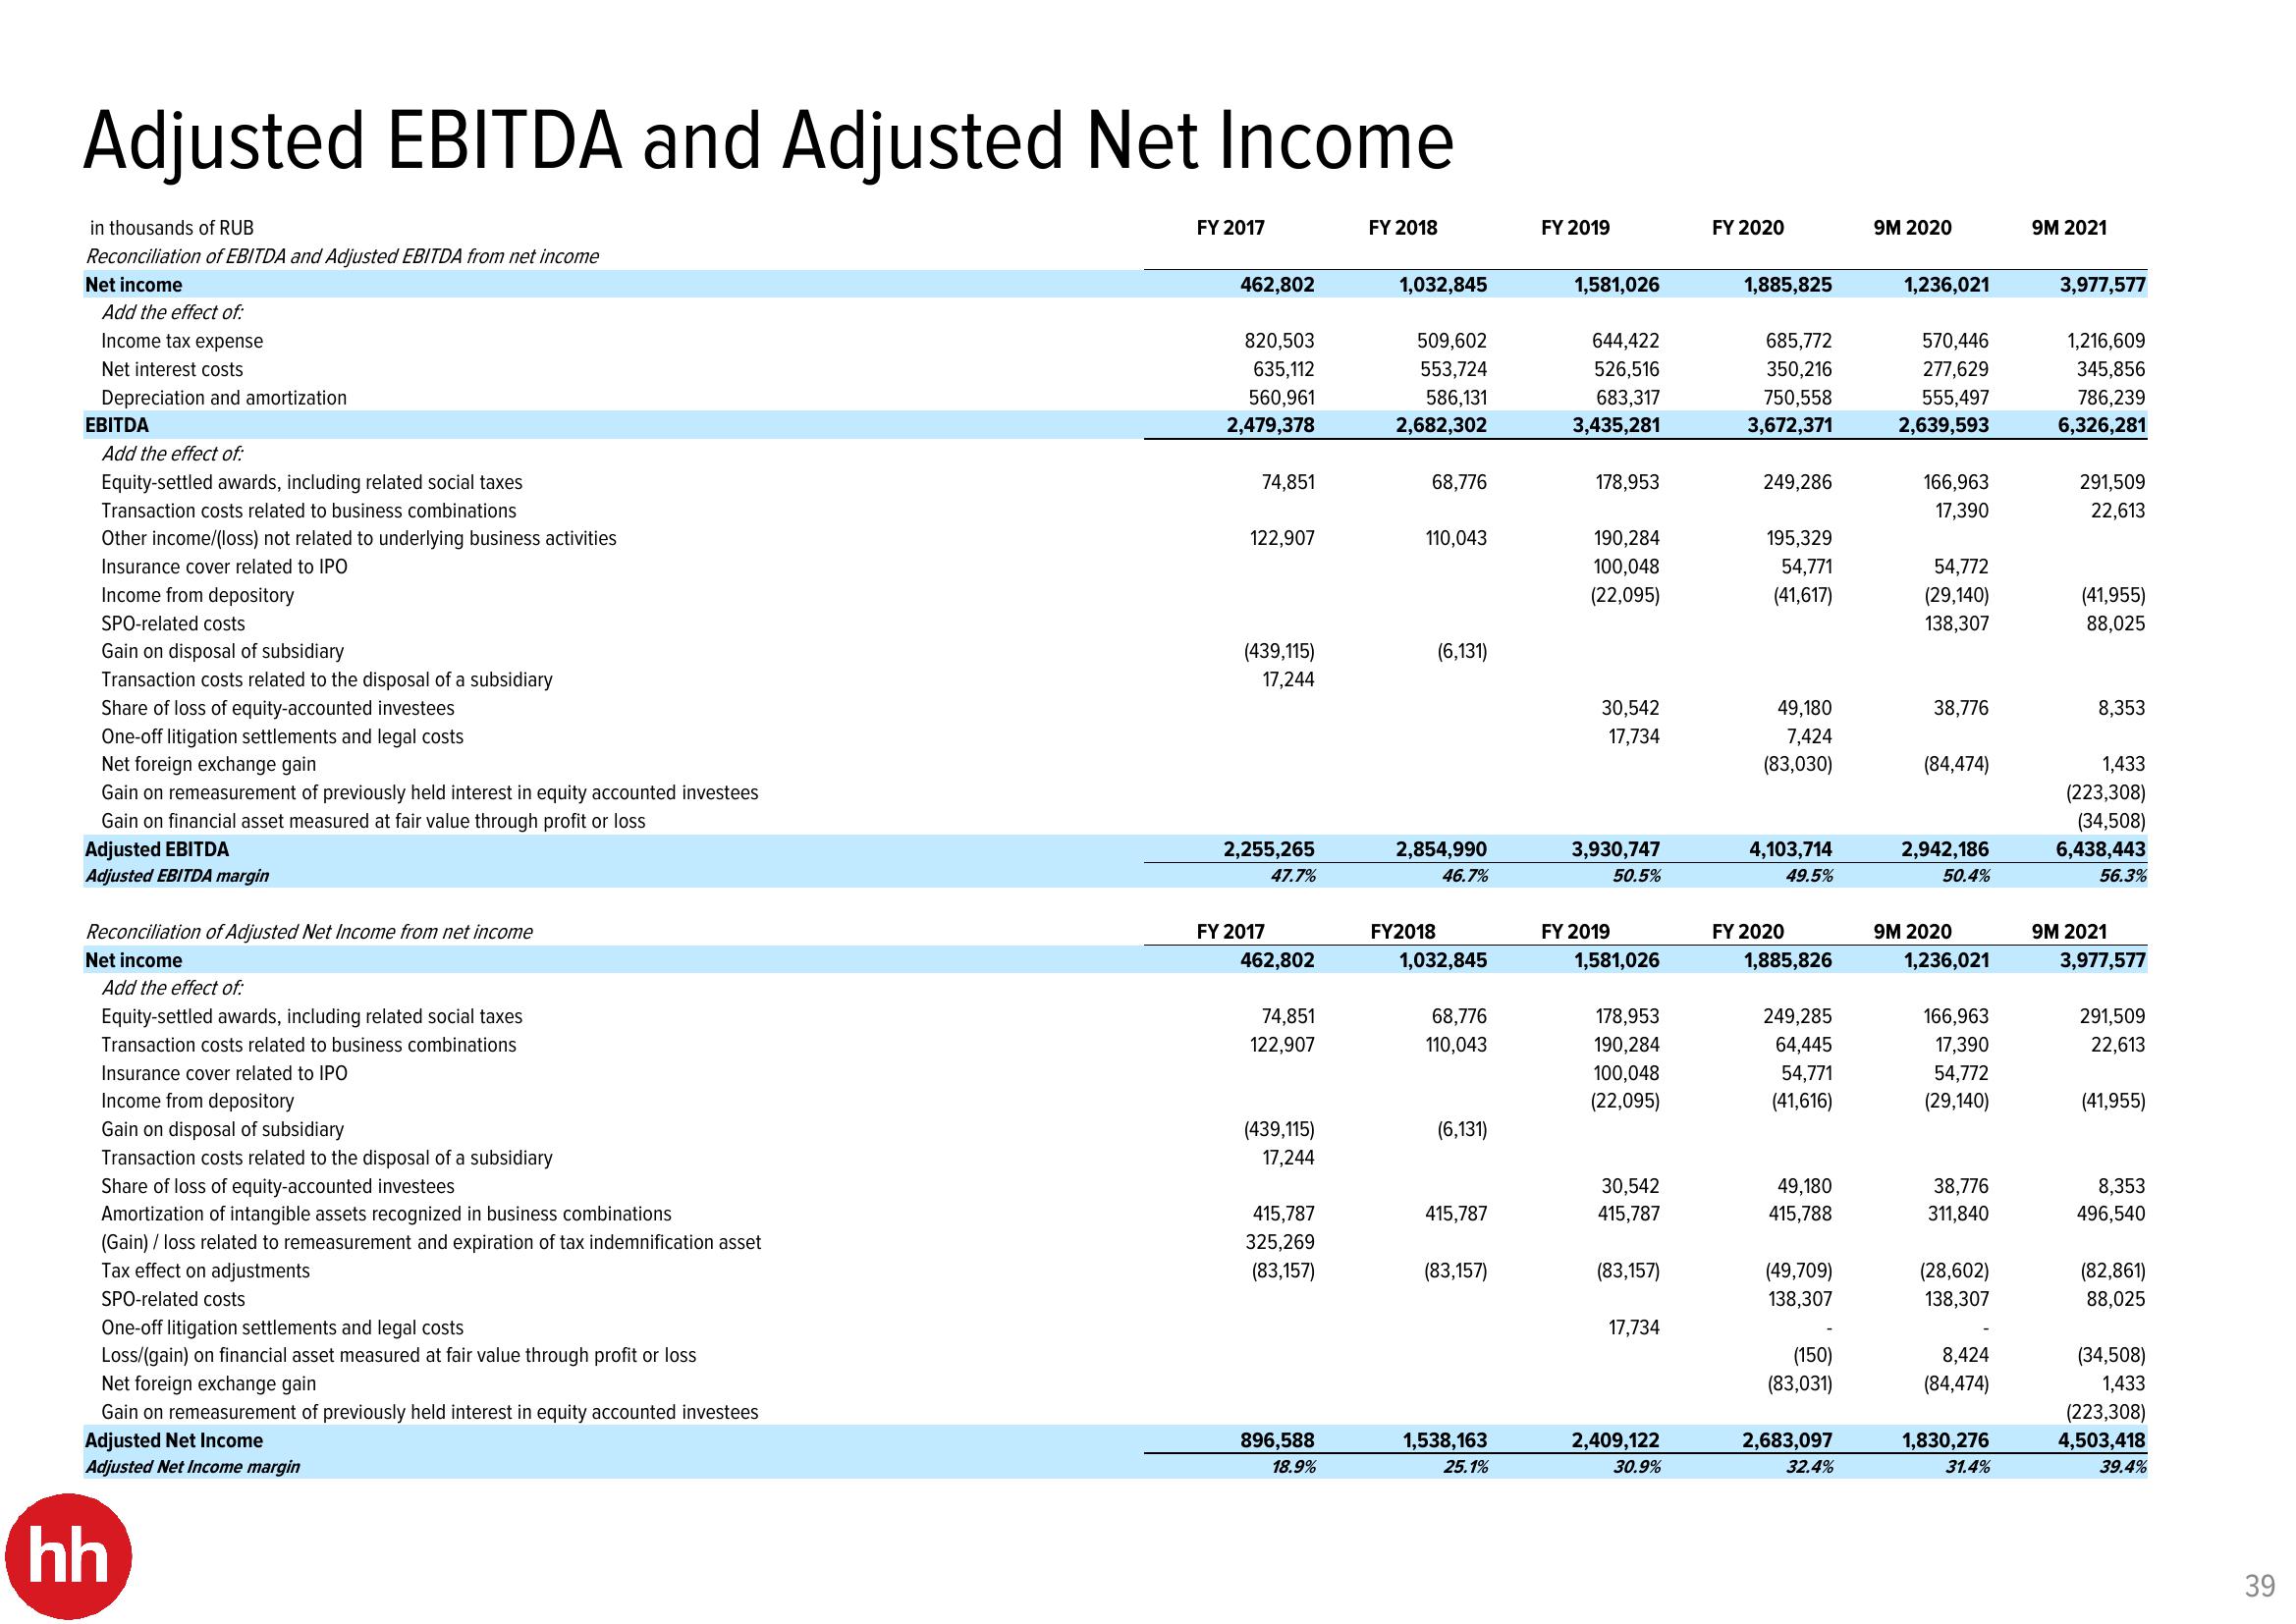
Adjusted EBITDA and Adjusted Net Income
in thousands of RUB
Reconciliation of EBITDA and Adjusted EBITDA from net income
Net income
Add the effect of:
Income tax expense
Net interest costs
Depreciation and amortization
EBITDA
Add the effect of:
Equity-settled awards, including related social taxes
Transaction costs related to business combinations
Other income/(loss) not related to underlying business activities
Insurance cover related to IPO
Income from depository
SPO-related costs
Gain on disposal of subsidiary
Transaction costs related to the disposal of a subsidiary
Share of loss of equity-accounted investees
One-off litigation settlements and legal costs
Net foreign exchange gain
Gain on remeasurement of previously held interest in equity accounted investees
Gain on financial asset measured at fair value through profit or loss
Adjusted EBITDA
Adjusted EBITDA margin
Reconciliation of Adjusted Net Income from net income
Net income
Add the effect of:
Equity-settled awards, including related social taxes
Transaction costs related to business combinations
Insurance cover related to IPO
Income from depository
Gain on disposal of subsidiary
Transaction costs related to the disposal of a subsidiary
Share of loss of equity-accounted investees
Amortization of intangible assets recognized in business combinations
(Gain) / loss related to remeasurement and expiration of tax indemnification asset
Tax effect on adjustments
SPO-related costs
One-off litigation settlements and legal costs
Loss/(gain) on financial asset measured at fair value through profit or loss
Net foreign exchange gain
Gain on remeasurement of previously held interest in equity accounted investees
Adjusted Net Income
Adjusted Net Income margin
hh
FY 2017
462,802
820,503
635,112
560,961
2,479,378
74,851
122,907
(439,115)
17,244
2,255,265
47.7%
FY 2017
462,802
74,851
122,907
(439,115)
17,244
415,787
325,269
(83,157)
896,588
18.9%
FY 2018
1,032,845
509,602
553,724
586,131
2,682,302
68,776
110,043
(6,131)
2,854,990
46.7%
FY2018
1,032,845
68,776
110,043
(6,131)
415,787
(83,157)
1,538,163
25.1%
FY 2019
1,581,026
644,422
526,516
683,317
3,435,281
178,953
190,284
100,048
(22,095)
30,542
17,734
3,930,747
50.5%
FY 2019
1,581,026
178,953
190,284
100,048
(22,095)
30,542
415,787
(83,157)
17,734
2,409,122
30.9%
FY 2020
1,885,825
685,772
350,216
750,558
3,672,371
249,286
195,329
54,771
(41,617)
49,180
7,424
(83,030)
4,103,714
49.5%
FY 2020
1,885,826
249,285
64,445
54,771
(41,616)
49,180
415,788
(49,709)
138,307
(150)
(83,031)
2,683,097
32.4%
9M 2020
1,236,021
570,446
277,629
555,497
2,639,593
166,963
17,390
54,772
(29,140)
138,307
38,776
(84,474)
2,942,186
50.4%
9M 2020
1,236,021
166,963
17,390
54,772
(29,140)
38,776
311,840
(28,602)
138,307
8,424
(84,474)
1,830,276
31.4%
9M 2021
3,977,577
1,216,609
345,856
786,239
6,326,281
291,509
22,613
(41,955)
88,025
8,353
1,433
(223,308)
(34,508)
6,438,443
56.3%
9M 2021
3,977,577
291,509
22,613
(41,955)
8,353
496,540
(82,861)
88,025
(34,508)
1,433
(223,308)
4,503,418
39.4%
39View entire presentation