IBEX Results Presentation Deck
ibex.
A
B
C
D
Reconciliation of Net Income to Adjusted Net Income
US$ in thousands, except
per share amounts,
unaudited
Net income
Non-recurring expenses
Warrant contra revenue
Foreign currency gains
Share-based payments
Loss on lease terminations
Gain on disposal of
subsidiaries
Total adjustments
Tax impact of adjustments
Adjusted net income
Adjusted Net Income
Margin
Adj. earnings per share -
diluted
Weighted average shares
outstanding - diluted
$
$
$
Three months ended
30-September
2023
7,425 $
O
287
-797
848
O
338 $
-189
7,574 $
6.1%
0.40
18,898
2022
6,523
O
286
-849
1,122
559
-284
6,798
5.3%
0.36
18,641
$
$
$
Twelve months ended
2023
30-Jun
31,582 $
2,224
1,090
-801
4,606
251
-246
7,124 $
-1,760
36,946 $
7.1%
1.96
18,893
2022
21,456
3,256
970
-57
1,851
6,020
-1,427
26,049
5.3%
1.39
18,724
A
B
C
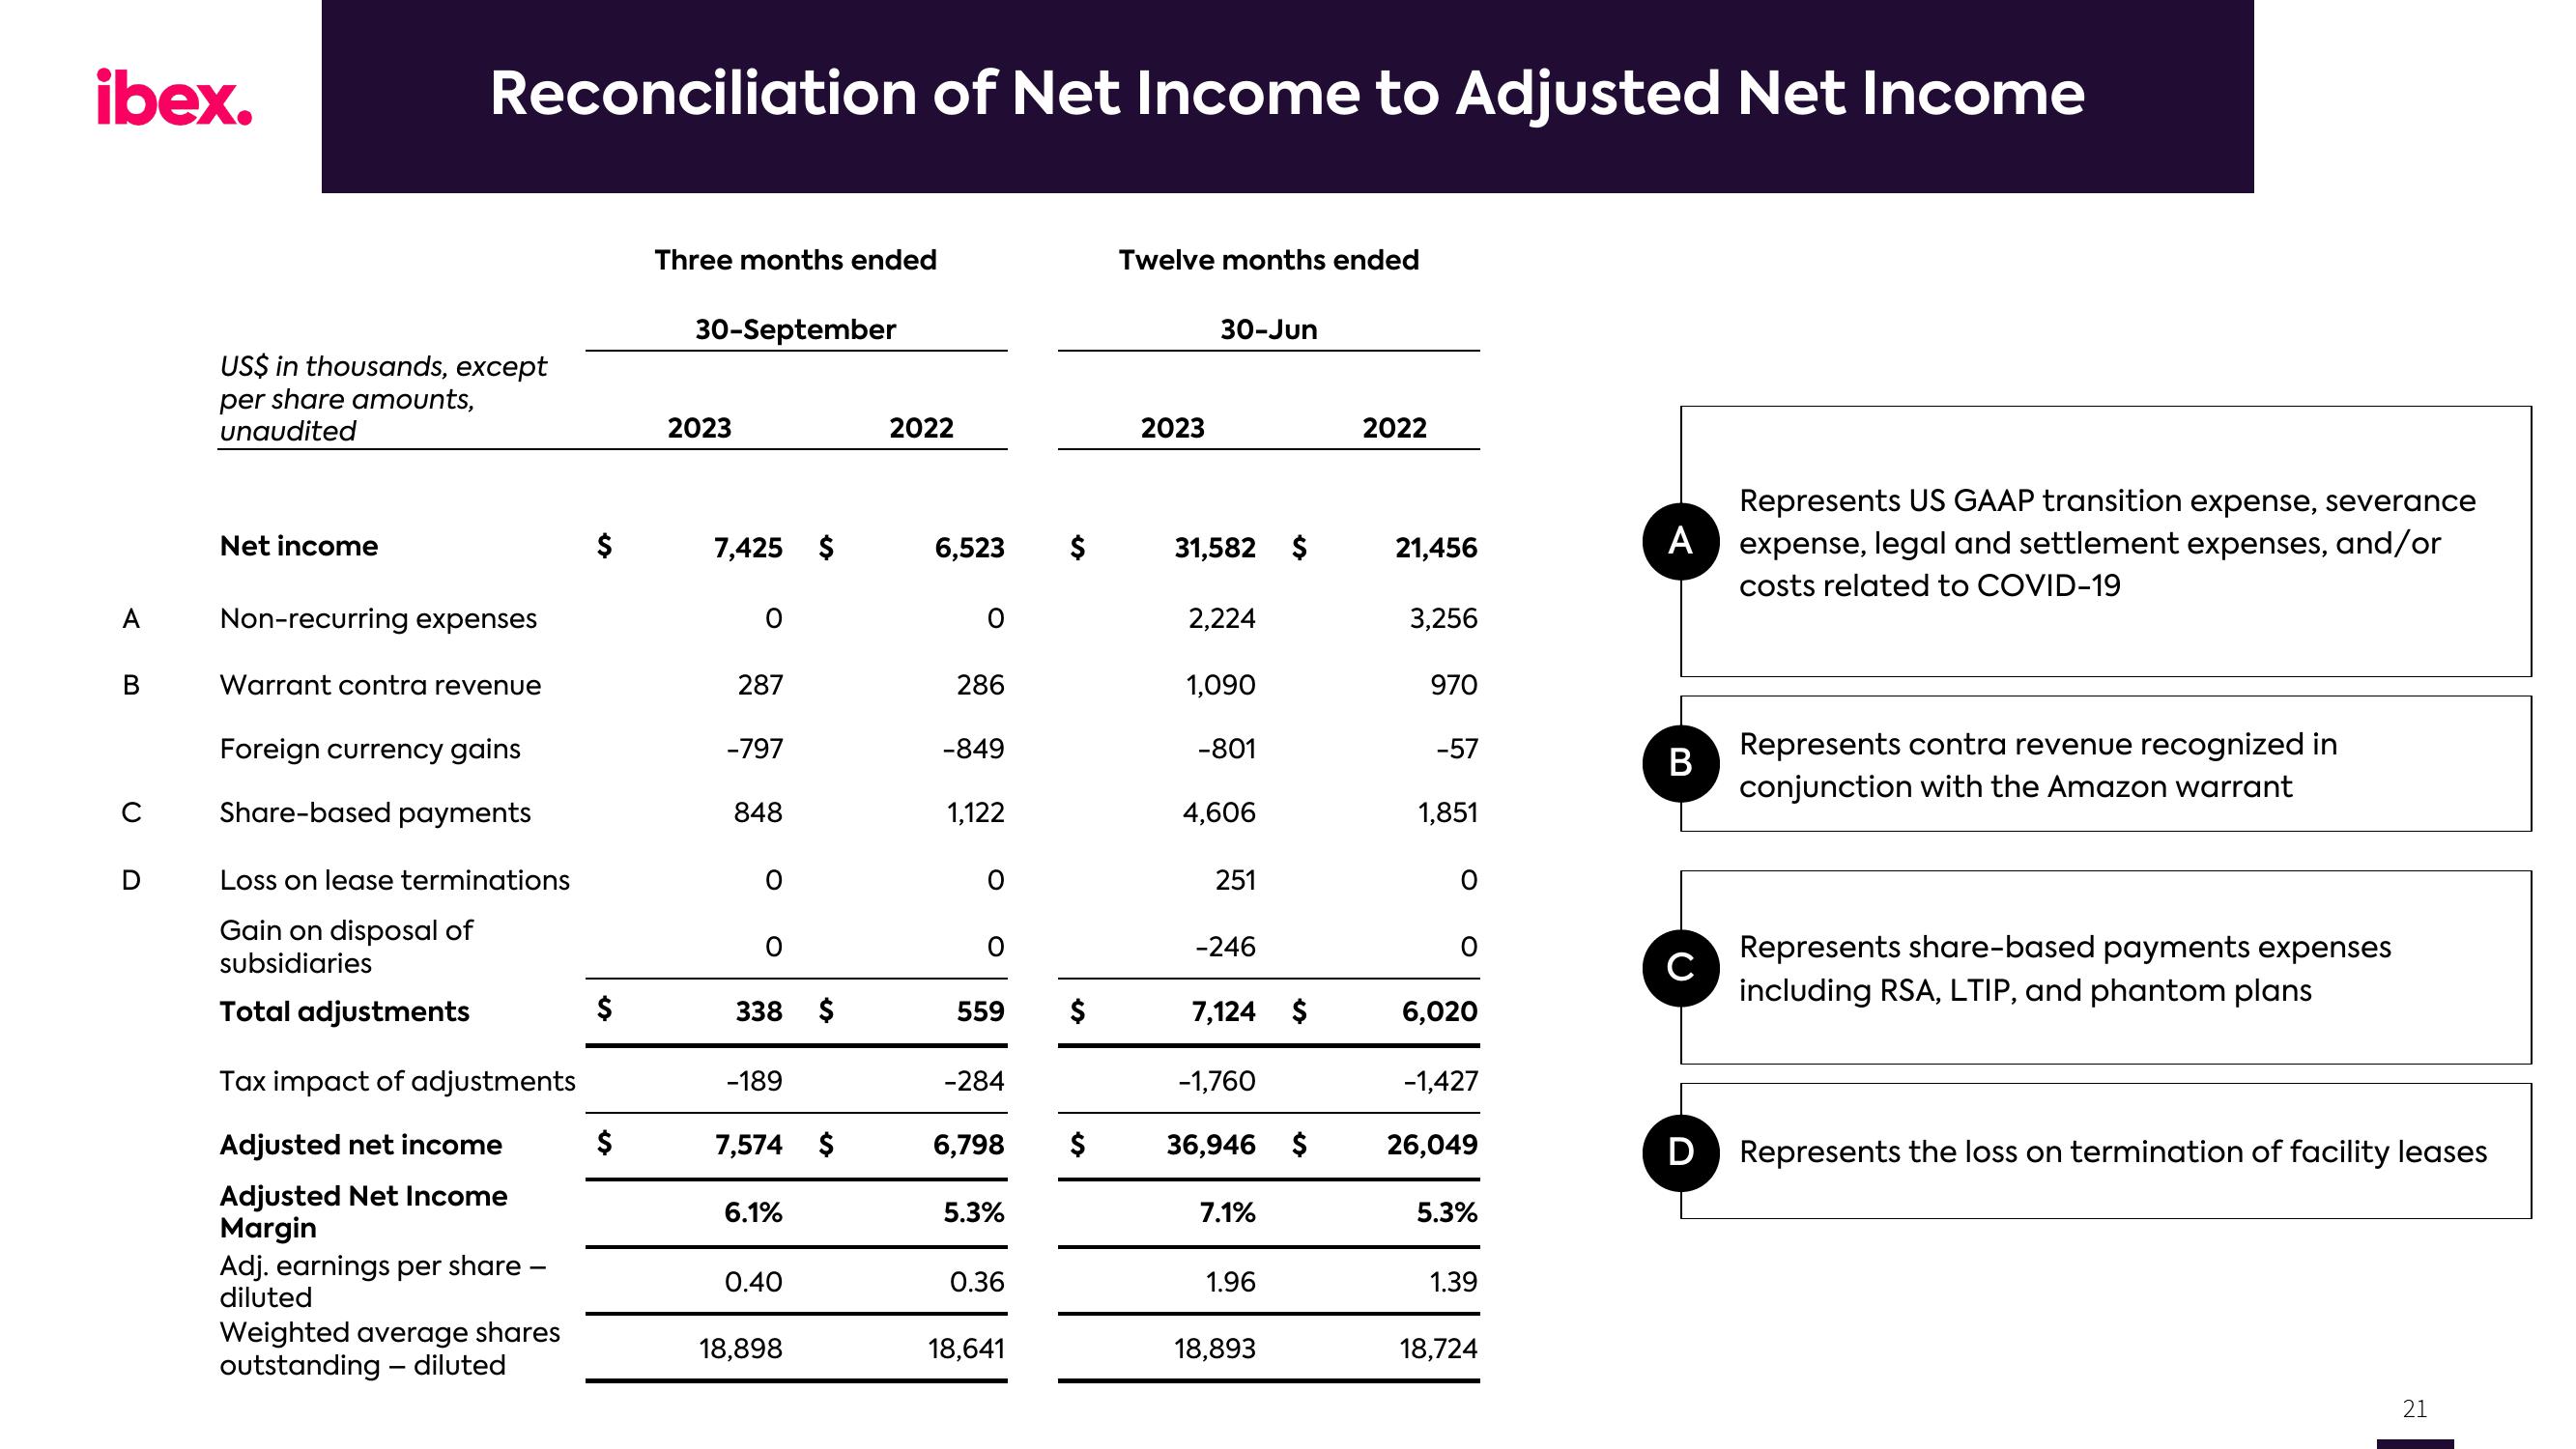
Represents US GAAP transition expense, severance
expense, legal and settlement expenses, and/or
costs related to COVID-19
Represents contra revenue recognized in
conjunction with the Amazon warrant
Represents share-based payments expenses
including RSA, LTIP, and phantom plans
D Represents the loss on termination of facility leases
21View entire presentation