Commercial Metals Company Results Presentation Deck
Q3 North America
Performance Summary
Units in 000's except per ton amounts
Adjusted EBITDA
Adjusted EBITDA per Ton of Finished Steel
Shipped
External Finished Steel Tons Shipped[¹]
Adjusted EBITDA Margin
Key Performance Drivers
Q3 2023 vs Q3 2022
●
.
.
•
Q3 '22
1,178
CMC
Q4 '22
1,132
18.7%
Q1 '23
1,086
18.5%
Q2 '23
$322 $327 $348 $308
972
$379,355 $370,516 $377,956 $299,311 $402,175
20.8%
18.2%
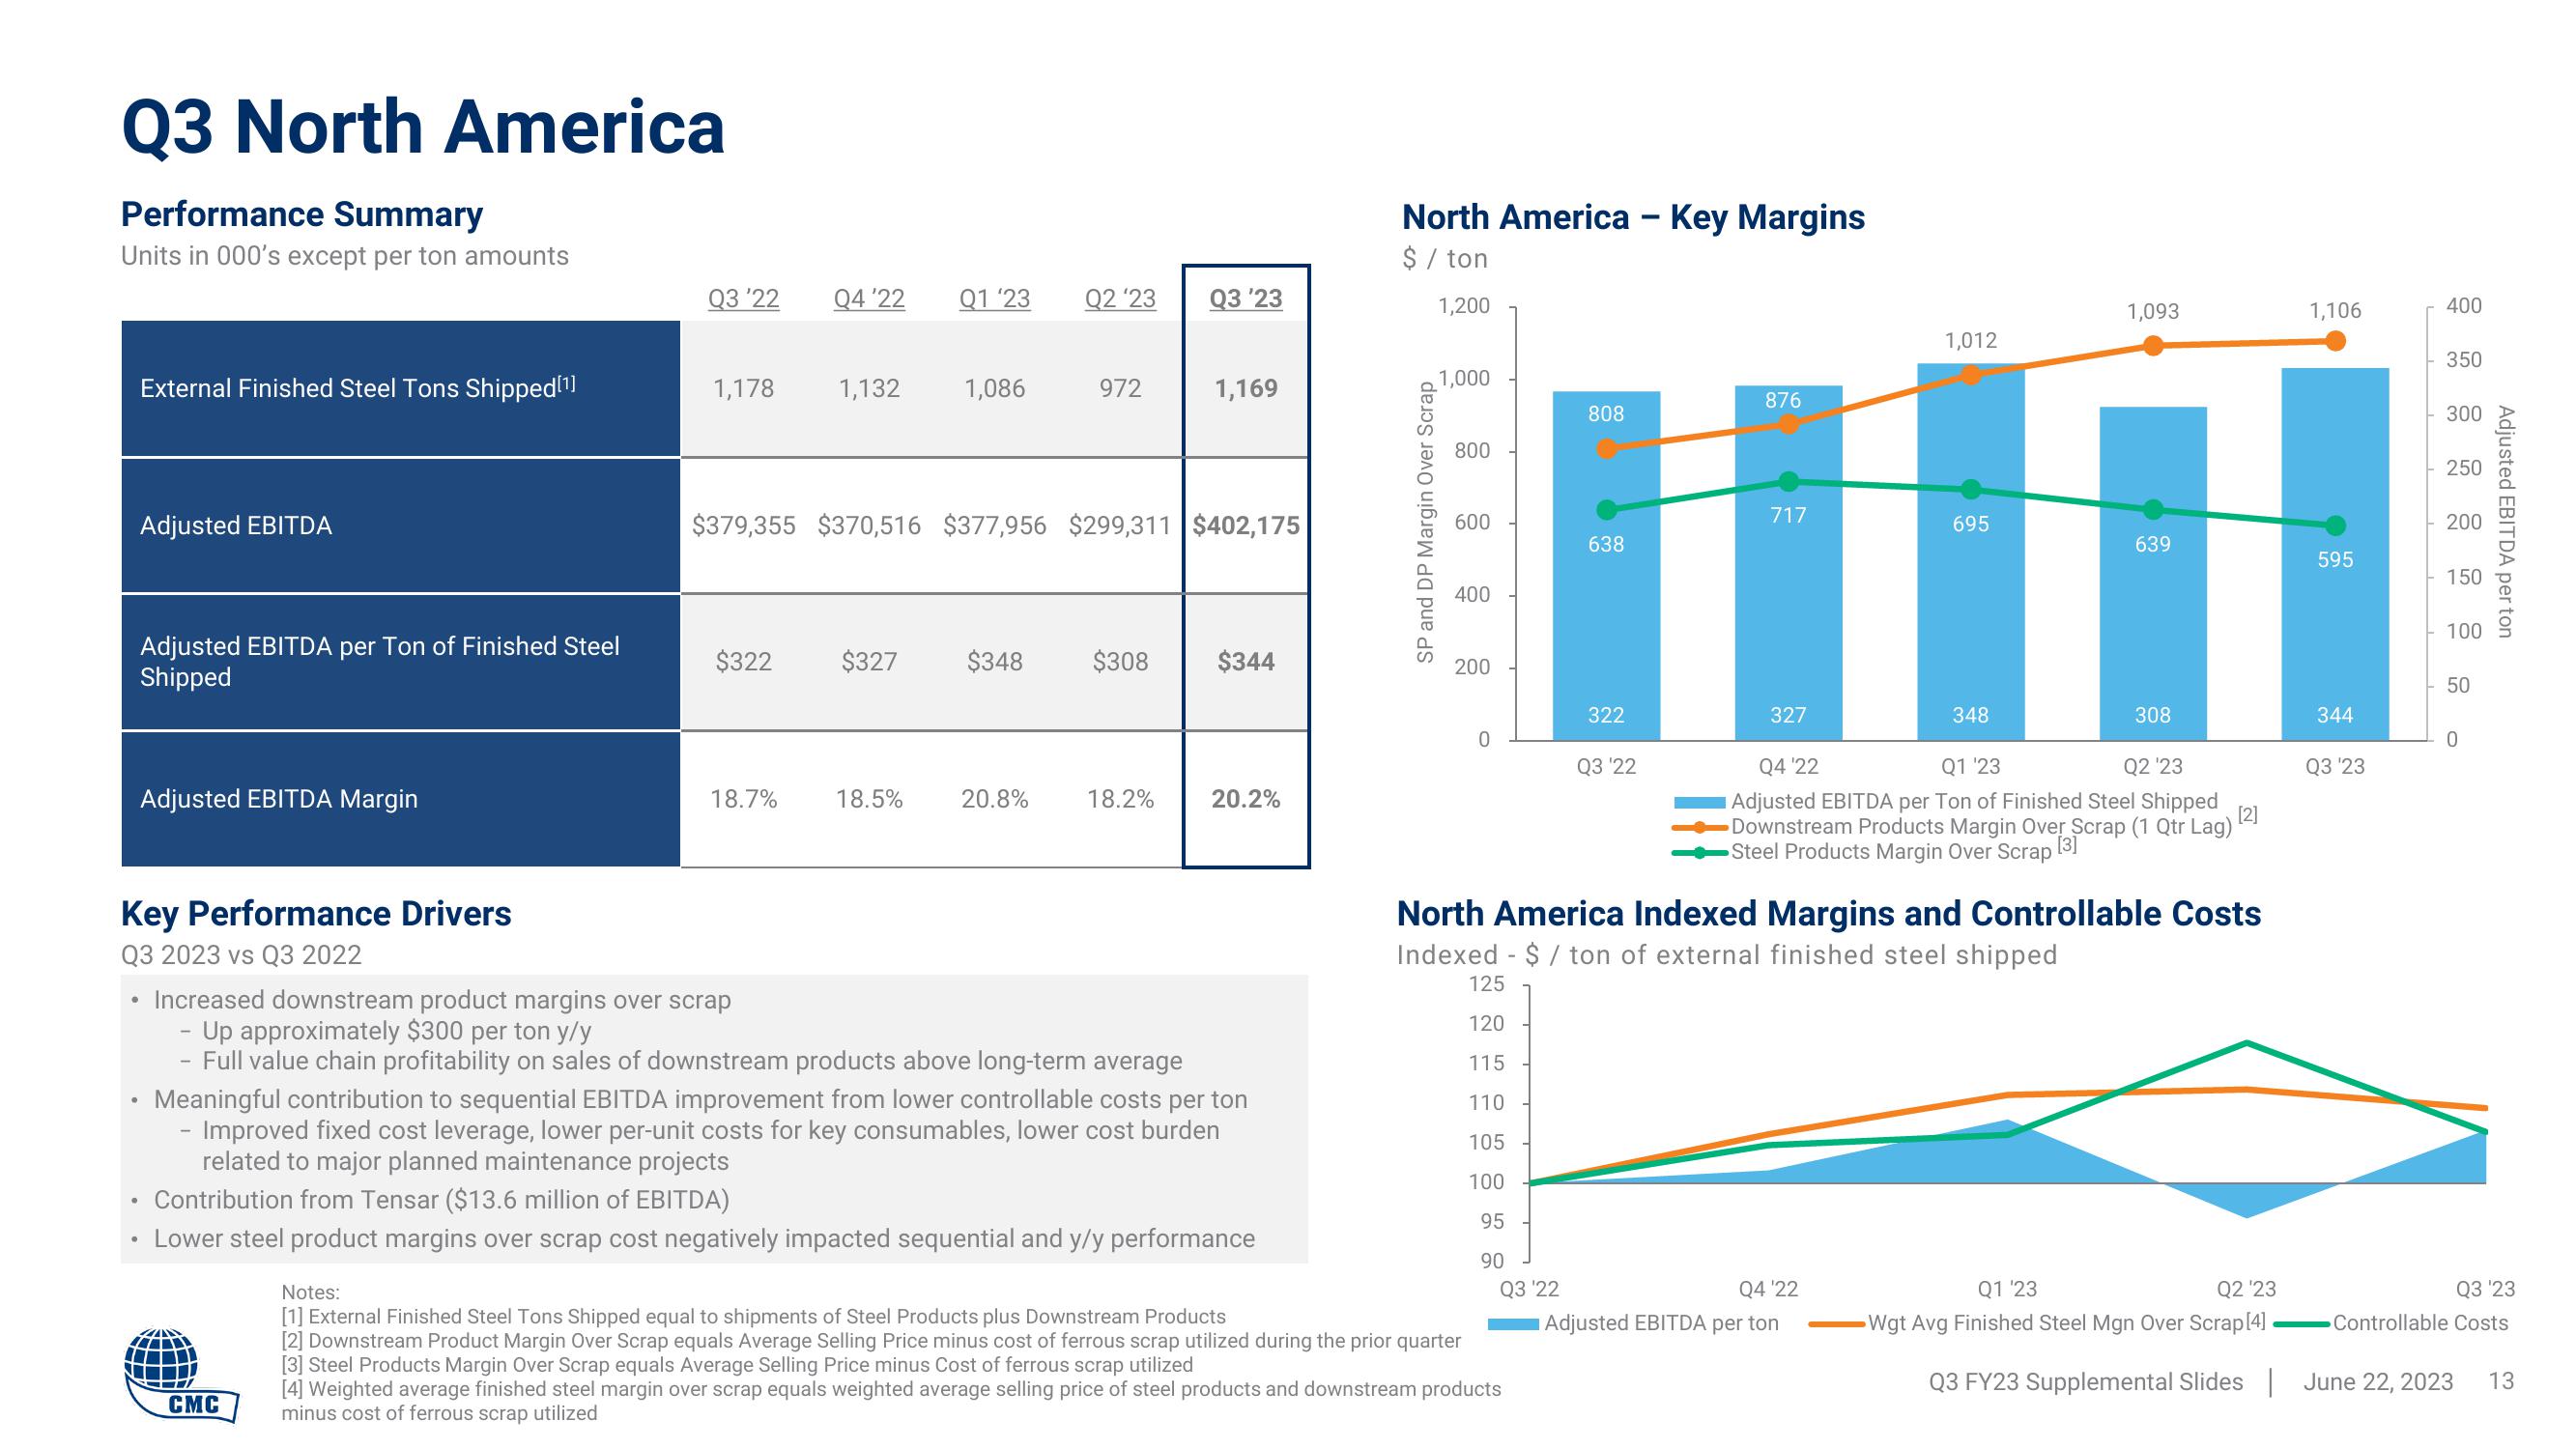
Increased downstream product margins over scrap
- Up approximately $300 per ton y/y
Full value chain profitability on sales of downstream products above long-term average
Q3 '23
1,169
$344
20.2%
Meaningful contribution to sequential EBITDA improvement from lower controllable costs per ton
- Improved fixed cost leverage, lower per-unit costs for key consumables, lower cost burden
related to major planned maintenance projects
Contribution from Tensar ($13.6 million of EBITDA)
Lower steel product margins over scrap cost negatively impacted sequential and y/y performance
North America - Key Margins
$ / ton
1,200
SP and DP Margin Over Scrap
1,000
800
600
400
200
0
808
Notes:
[1] External Finished Steel Tons Shipped equal to shipments of Steel Products plus Downstream Products
[2] Downstream Product Margin Over Scrap equals Average Selling Price minus cost of ferrous scrap utilized during the prior quarter
[3] Steel Products Margin Over Scrap equals Average Selling Price minus Cost of ferrous scrap utilized
[4] Weighted average finished steel margin over scrap equals weighted average selling price of steel products and downstream products
minus cost of ferrous scrap utilized
638
322
Q3 '22
876
717
327
1,012
695
Q4 '22
Adjusted EBITDA per ton
348
1,093
639
308
Q4 '22
Q1 '23
Q2 '23
Adjusted EBITDA per Ton of Finished Steel Shipped
Downstream Products Margin Over Scrap (1 Qtr Lag) [2²]
Steel Products Margin Over Scrap [3]
North America Indexed Margins and Controllable Costs
Indexed - $ / ton of external finished steel shipped
125
120
115
110
105
100
95
90
Q3 '22
Q1 '23
Q2 '23
Wgt Avg Finished Steel Mgn Over Scrap [4]
1,106
595
344
Q3 '23
400
350
300
250
200
150
100
50
0
Adjusted EBITDA per ton
Q3 '23
Controllable Costs
Q3 FY23 Supplemental Slides June 22, 2023 13View entire presentation