Investor Presentation
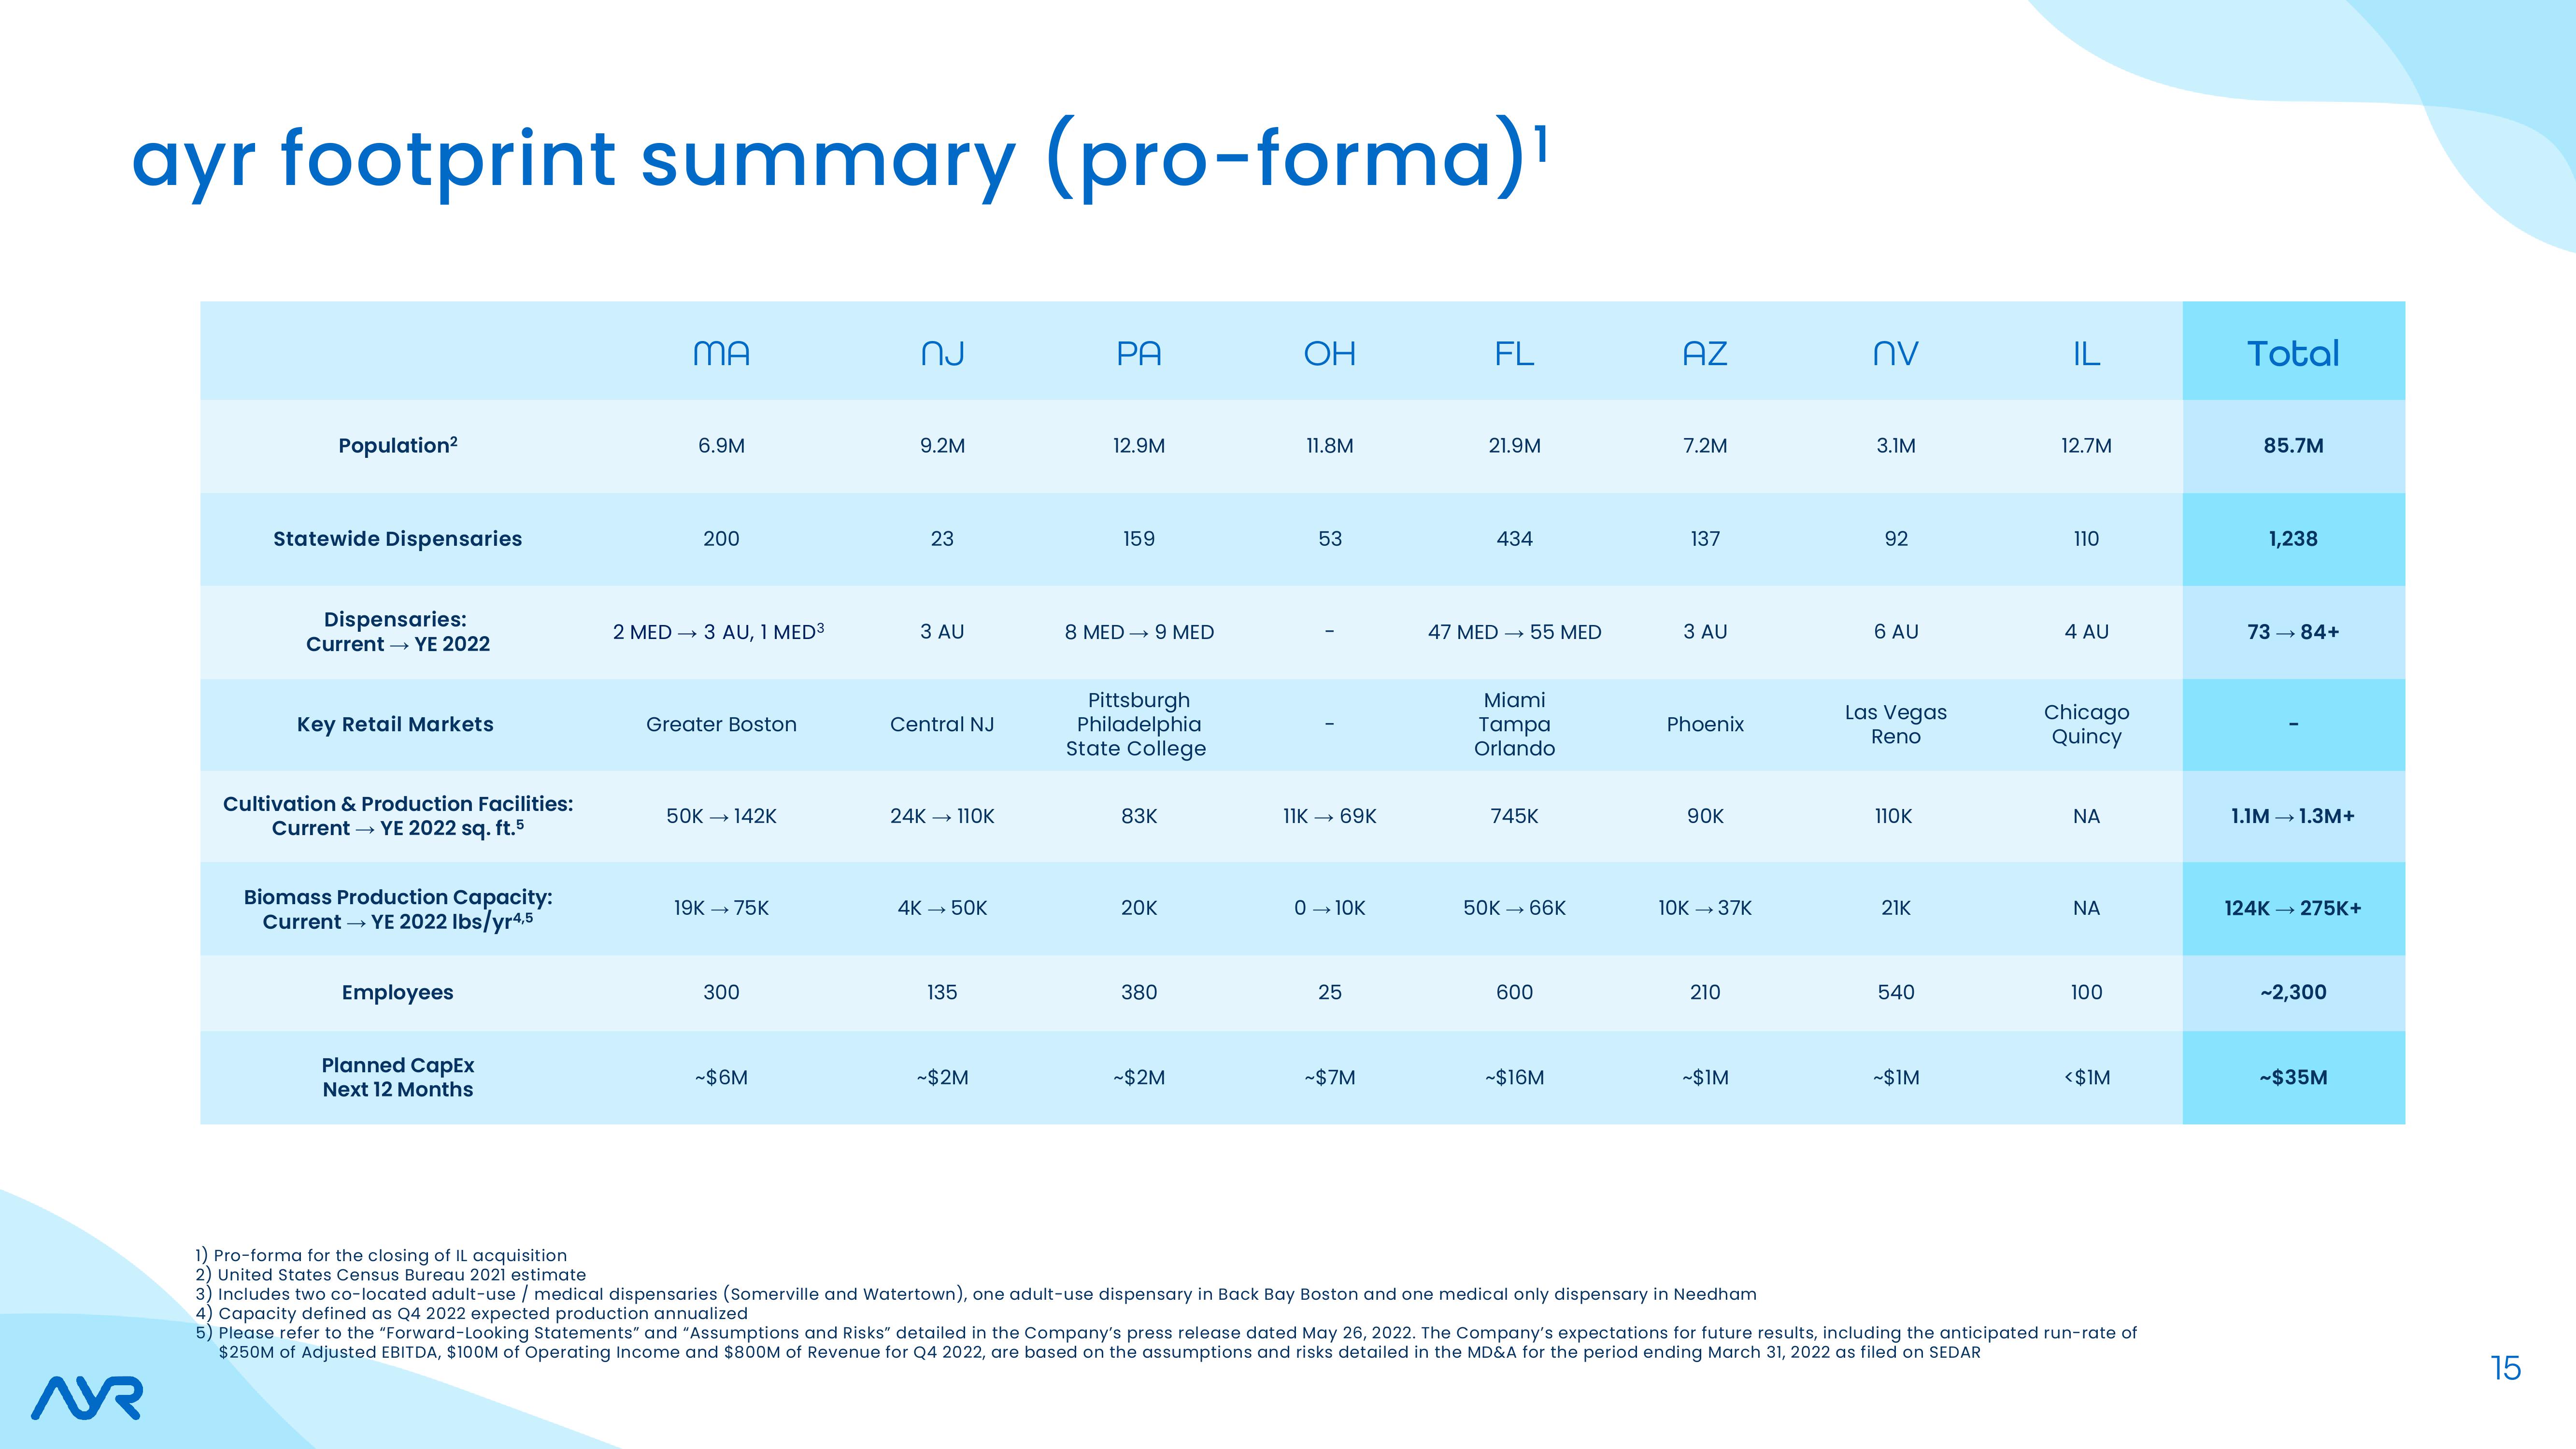
ayr footprint summary (pro-forma)¹
AR
Population²
Statewide Dispensaries
Dispensaries:
Current → YE 2022
Key Retail Markets
Cultivation & Production Facilities:
Current → YE 2022 sq. ft.5
Biomass Production Capacity:
Current → YE 2022 lbs/yr4,5
Employees
Planned CapEx
Next 12 Months
MA
6.9M
200
2 MED→3 AU, 1 MED³
Greater Boston
50K → 142K
19K → 75K
300
~$6M
nj
9.2M
23
3 AU
Central NJ
24K → 110K
4K →→ 50K
135
~$2M
PA
12.9M
159
8 MED → 9 MED
Pittsburgh
Philadelphia
State College
83K
20K
380
~$2M
OH
11.8M
53
11K →→ 69K
0 → 10K
25
~$7M
FL
21.9M
434
47 MED →→→ 55 MED
Miami
Tampa
Orlando
745K
50K → 66K
600
-$16M
AZ
7.2M
137
3 AU
Phoenix
90K
10K → 37K
210
~$1M
πν
3.1M
92
6 AU
Las Vegas
Reno
110K
21K
540
~$1M
IL
12.7M
110
4 AU
Chicago
Quincy
ΝΑ
ΝΑ
100
<$1M
1) Pro-forma for the closing of IL acquisition
2) United States Census Bureau 2021 estimate
3) Includes two co-located adult-use / medical dispensaries (Somerville and Watertown), one adult-use dispensary in Back Bay Boston and one medical only dispensary in Needham
4) Capacity defined as Q4 2022 expected production annualized
5) Please refer to the "Forward-Looking Statements" and "Assumptions and Risks" detailed in the Company's press release dated May 26, 2022. The Company's expectations for future results, including the anticipated run-rate of
$250M of Adjusted EBITDA, $100M of Operating Income and $800M of Revenue for Q4 2022, are based on the assumptions and risks detailed in the MD&A for the period ending March 31, 2022 as filed on SEDAR
Total
85.7M
1,238
73 → 84+
1.1M →→ 1.3M+
124K → 275K+
~2,300
~$35M
15View entire presentation