Sonos Results Presentation Deck
Cash flow & balance sheet highlights
Cash flow from operations
Capital expenditures
% of revenue
Free cash flow
Free cash flow / Adj EBITDA
Ending cash & cash equivalents
Total debt
YTD22
$82.4
$15.7
1.5%
$66.7
32%
$606.7
$
YTD21
$176.0
$19.9
2.0%
$156.0
73%
$639.1
$-
Y/Y Change
(53.2)%
(21.4)%
(57.2)%
(5.1)%
N/A
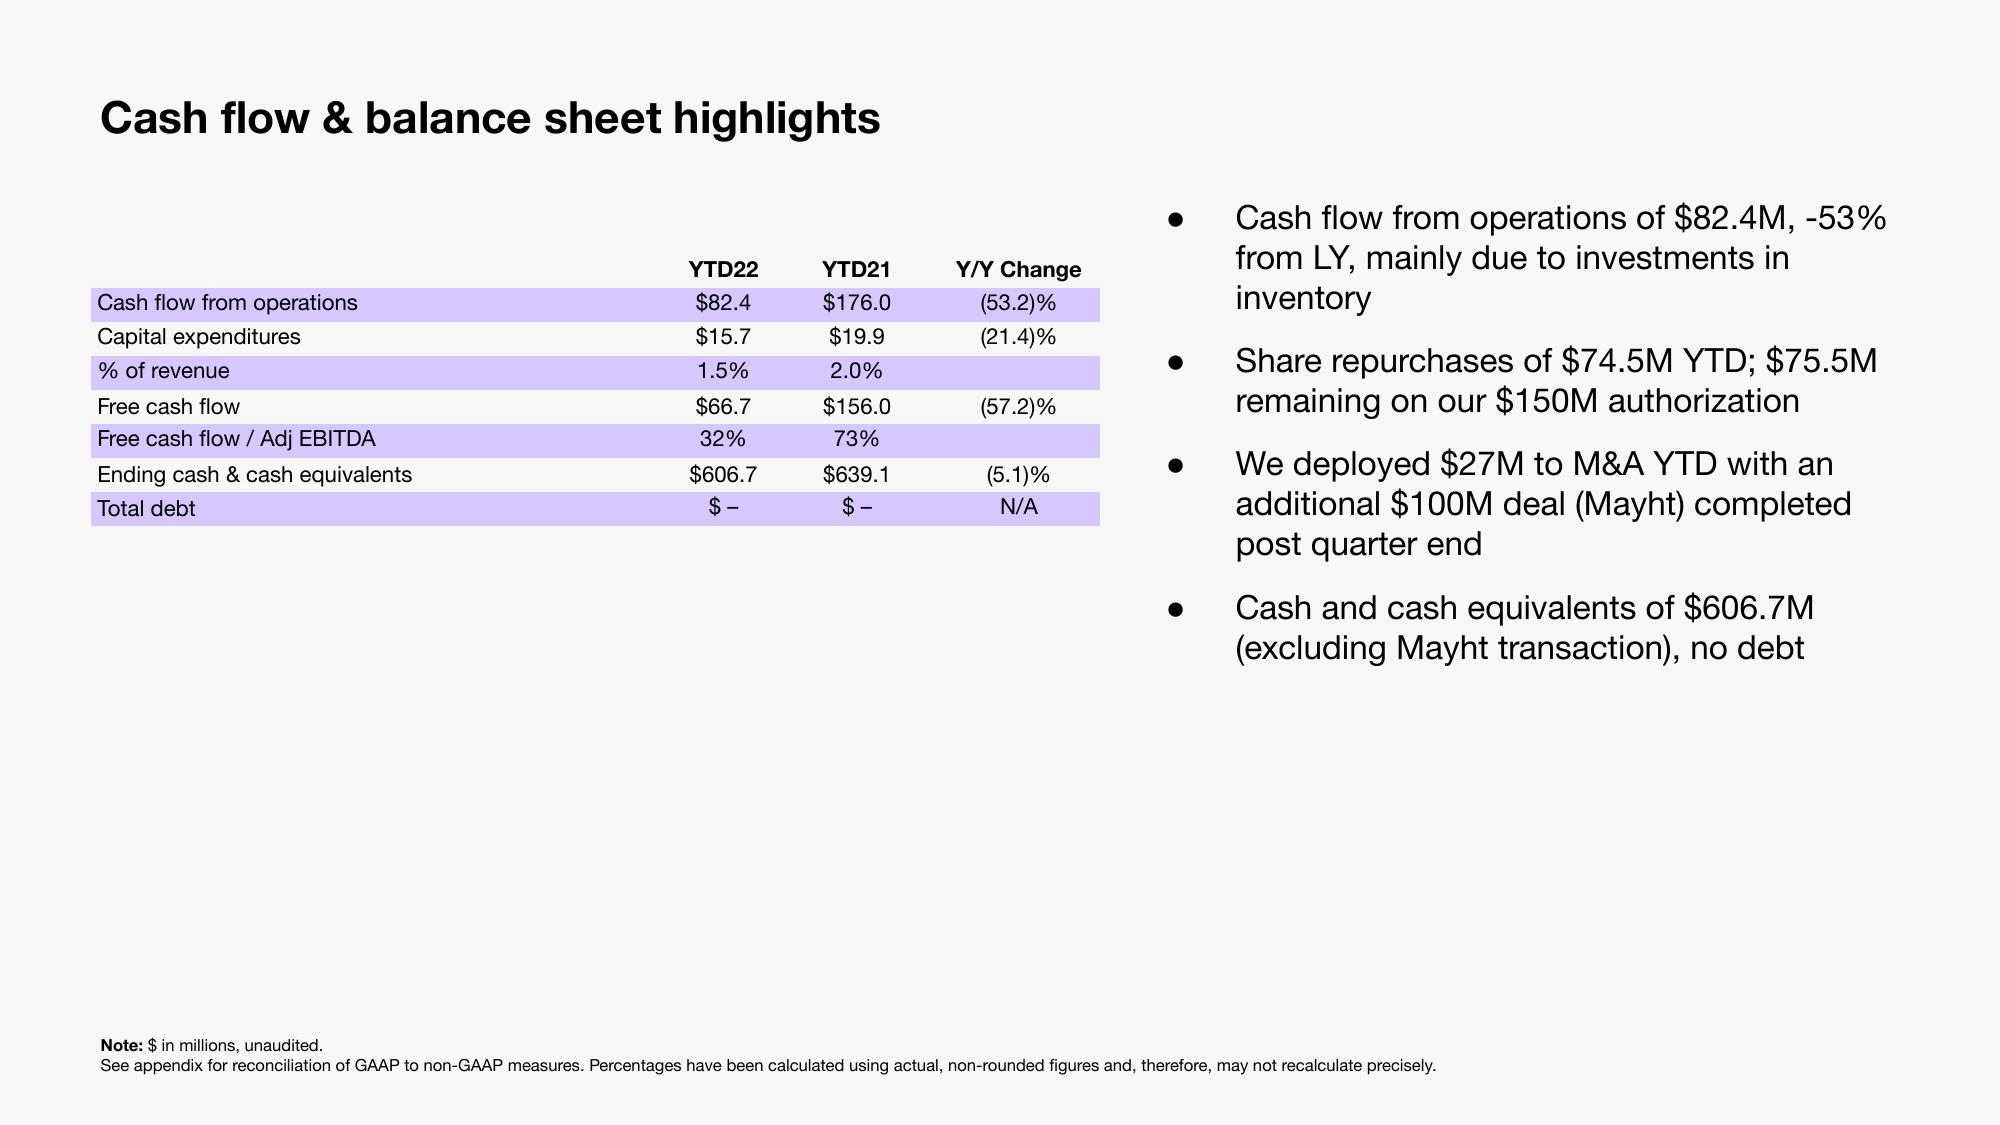
Cash flow from operations of $82.4M, -53%
from LY, mainly due to investments in
inventory
Share repurchases of $74.5M YTD; $75.5M
remaining on our $150M authorization
We deployed $27M to M&A YTD with an
additional $100M deal (Mayht) completed
post quarter end
Cash and cash equivalents of $606.7M
(excluding Mayht transaction), no debt
Note: $ in millions, unaudited.
See appendix for reconciliation of GAAP to non-GAAP measures. Percentages have been calculated using actual, non-rounded figures and, therefore, may not recalculate precisely.View entire presentation