Bausch+Lomb Results Presentation Deck
2Q22 Highlights
Bausch + Lomb
+1% 2Q22 Reported Revenue
+6% 2Q22 Organic Revenue ¹,2
+6% 2Q22 Constant Currency¹
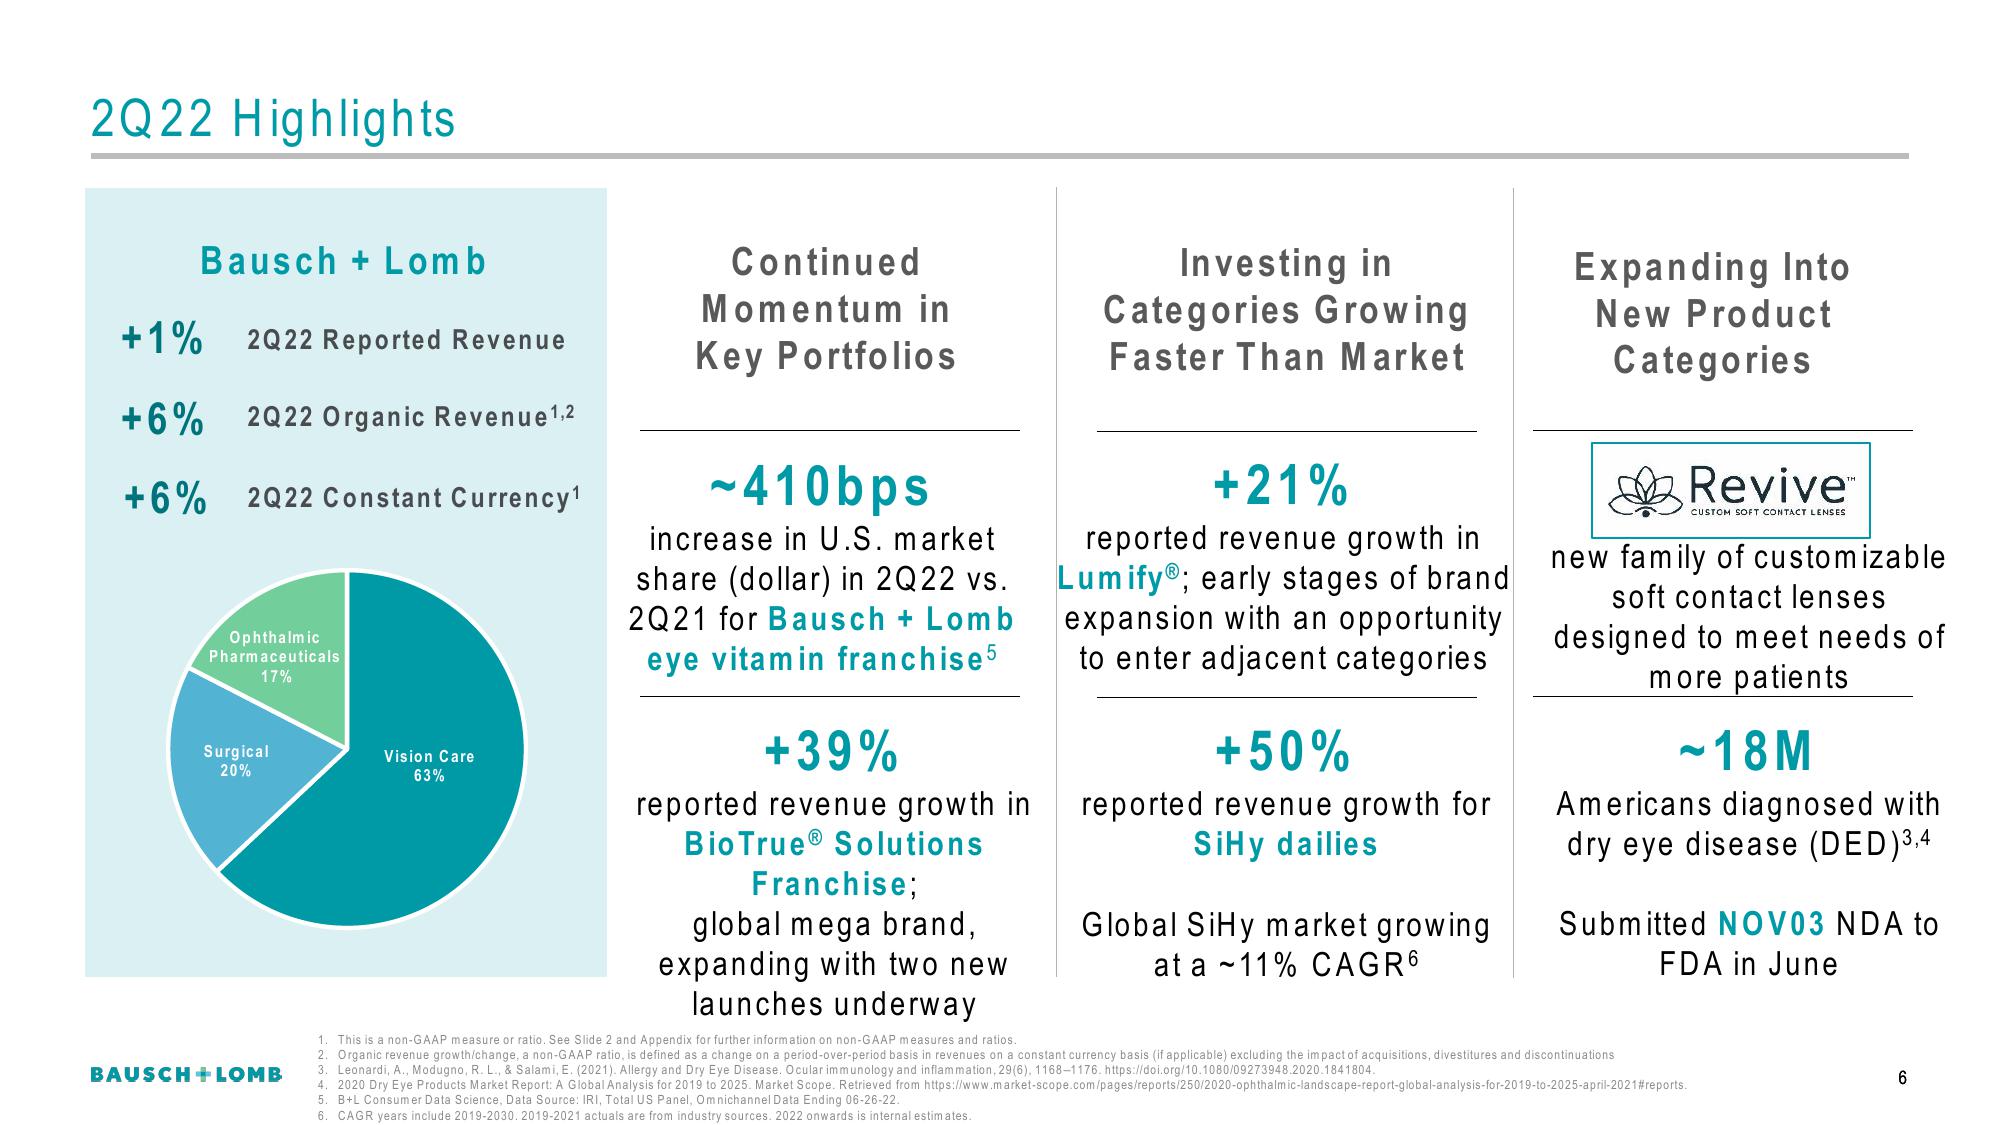
Ophthalmic
Pharmaceuticals
17%
Surgical
20%
BAUSCH + LOMB
Vision Care
63%
Continued
Momentum in
Key Portfolios
-410bps
increase in U.S. market
share (dollar) in 2Q22 vs.
2Q21 for Bausch + Lomb
eye vitamin franchise5
+39%
reported revenue growth in
Bio True® Solutions
Franchise;
global mega brand,
expanding with two new
launches underway
Investing in
Categories Growing
Faster Than Market
+21%
reported revenue growth in
Lumify; early stages of brand
expansion with an opportunity
to enter adjacent categories
+50%
reported revenue growth for
SiHy dailies
Global SiHy market growing
at a 11% CAGR6
Expanding Into
New Product
Categories
Revive™
CUSTOM SOFT CONTACT LENSES
new family of customizable
soft contact lenses
designed to meet needs of
more patients
~18M
Americans diagnosed with
dry eye disease (DED) 3,4
Submitted NOV03 NDA to
FDA in June
1. This is a non-GAAP measure or ratio. See Slide 2 and Appendix for further information on non-GAAP measures and ratios.
2. Organic revenue growth/change, a non-GAAP ratio, is defined as a change on a period-over-period basis in revenues on a constant currency basis (if applicable) excluding the impact of acquisitions, divestitures and discontinuations
3. Leonardi, A., Modugno, R. L., & Salami, E. (2021). Allergy and Dry Eye Disease. Ocular immunology and inflammation, 29(6), 1168-1176. https://doi.org/10.1080/09273948.2020.1841804.
4. 2020 Dry Eye Products Market Report: A Global Analysis for 2019 to 2025. Market Scope. Retrieved from https://www.market-scope.com/pages/reports/250/2020-ophthalmic-landscape-report-global-analysis-for-2019-to-2025-april-2021#reports.
5. B+L Consumer Data Science, Data Source: IRI, Total US Panel, Omnichannel Data Ending 06-26-22.
6. CAGR years include 2019-2030. 2019-2021 actuals are from industry sources. 2022 onwards is internal estimates.
6View entire presentation