Rent The Runway Results Presentation Deck
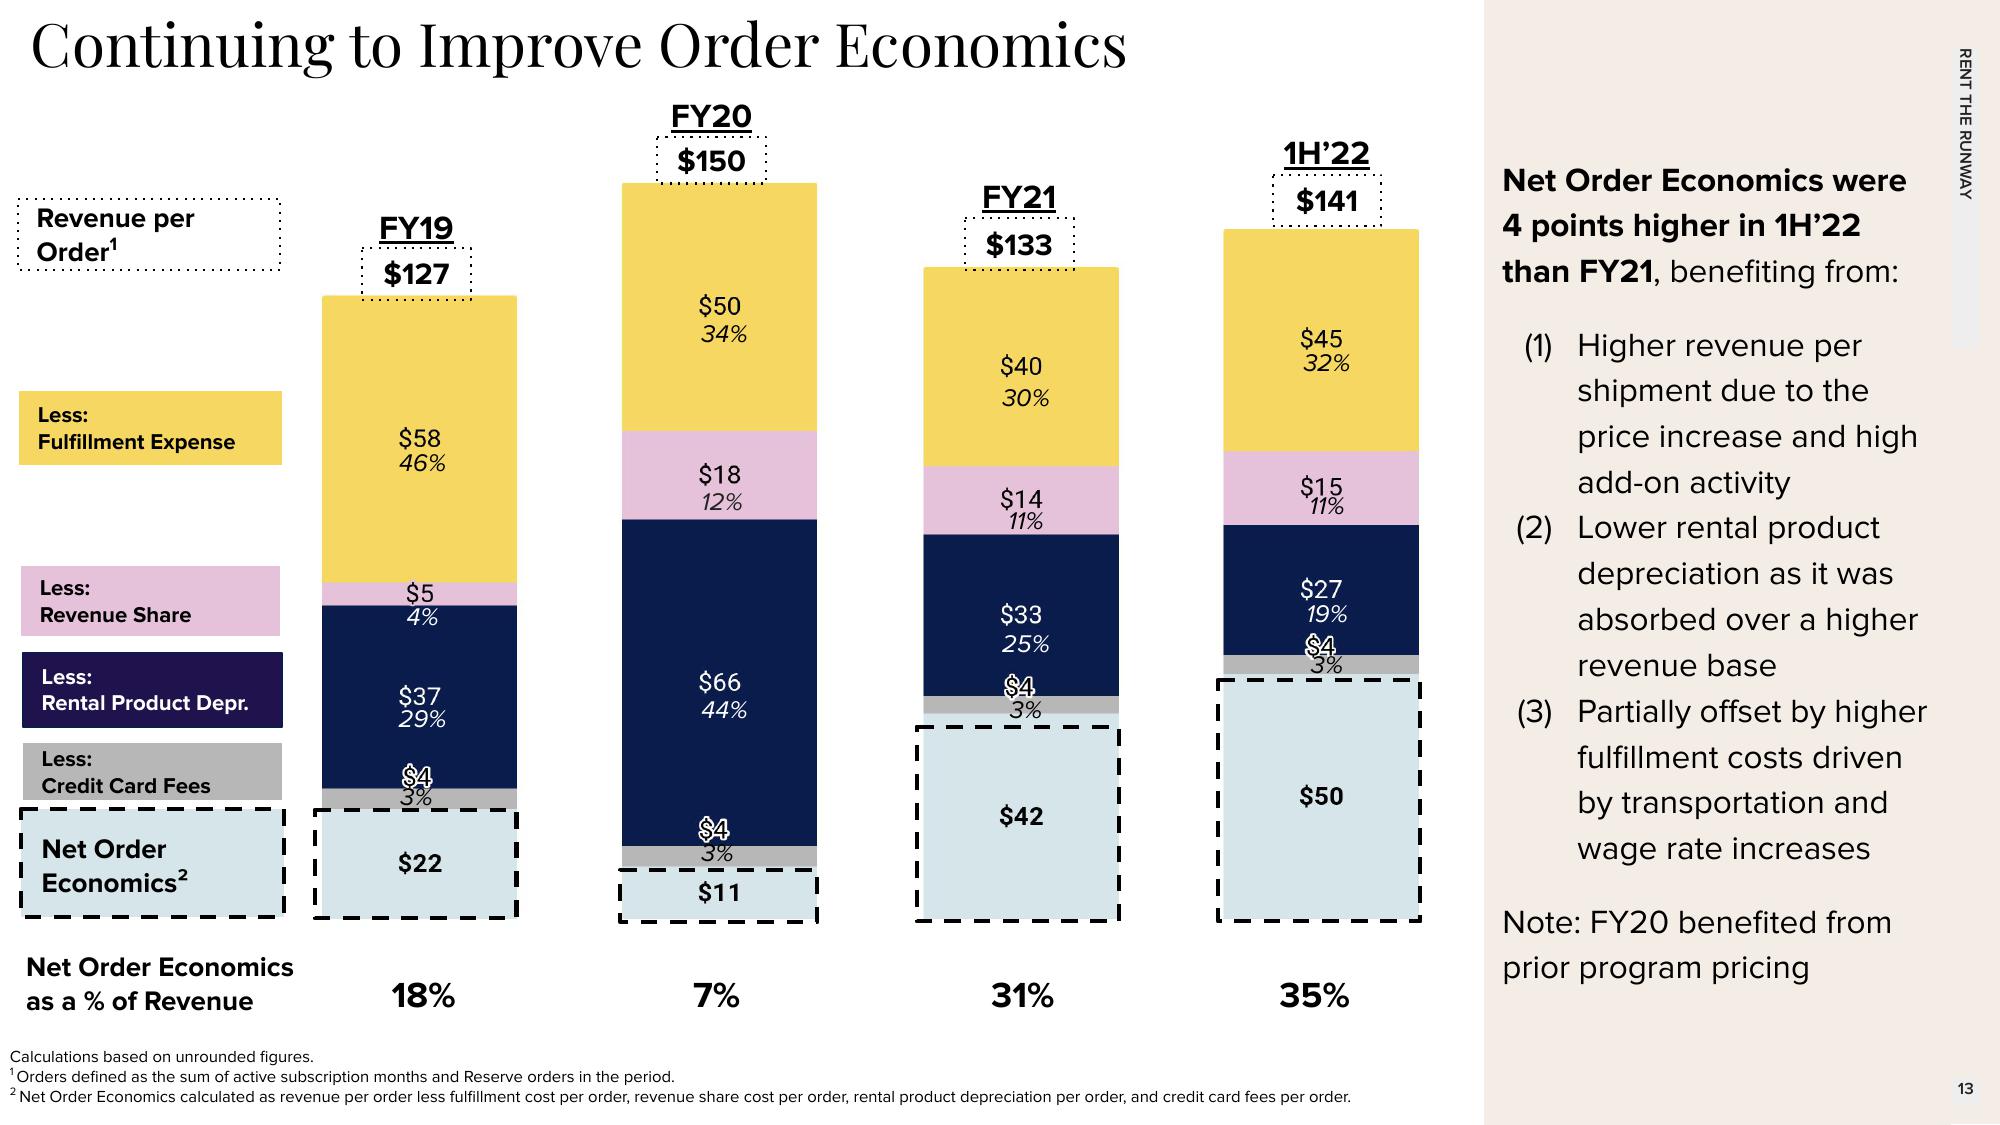
Continuing to Improve Order Economics
FY20
$150
Revenue per
Order¹
Less:
Fulfillment Expense
Less:
Revenue Share
Less:
Rental Product Depr.
Less:
Credit Card Fees
Net Order
Economics²
Net Order Economics
as a % of Revenue
FY19
$127
$58
46%
$5
4%
$37
29%
$22
18%
$50
34%
$18
12%
$66
44%
$11
7%
FY21
$133
$40
30%
$14
11%
$33
25%
$4
3%
$42
31%
1H'22
$141
$45
32%
$15
11%
$27
19%
$50
35%
Calculations based on unrounded figures.
¹Orders defined as the sum of active subscription months and Reserve orders in the period.
2 Net Order Economics calculated as revenue per order less fulfillment cost per order, revenue share cost per order, rental product depreciation per order, and credit card fees per order.
Net Order Economics were
4 points higher in 1H'22
than FY21, benefiting from:
(1) Higher revenue per
shipment due to the
price increase and high
add-on activity
(2) Lower rental product
depreciation as it was
absorbed over a higher
revenue base
(3) Partially offset by higher
fulfillment costs driven
by transportation and
wage rate increases
Note: FY20 benefited from
prior program pricing
RENT THE RUNWAY
13View entire presentation