BuzzFeed SPAC Presentation Deck
BuzzFeed
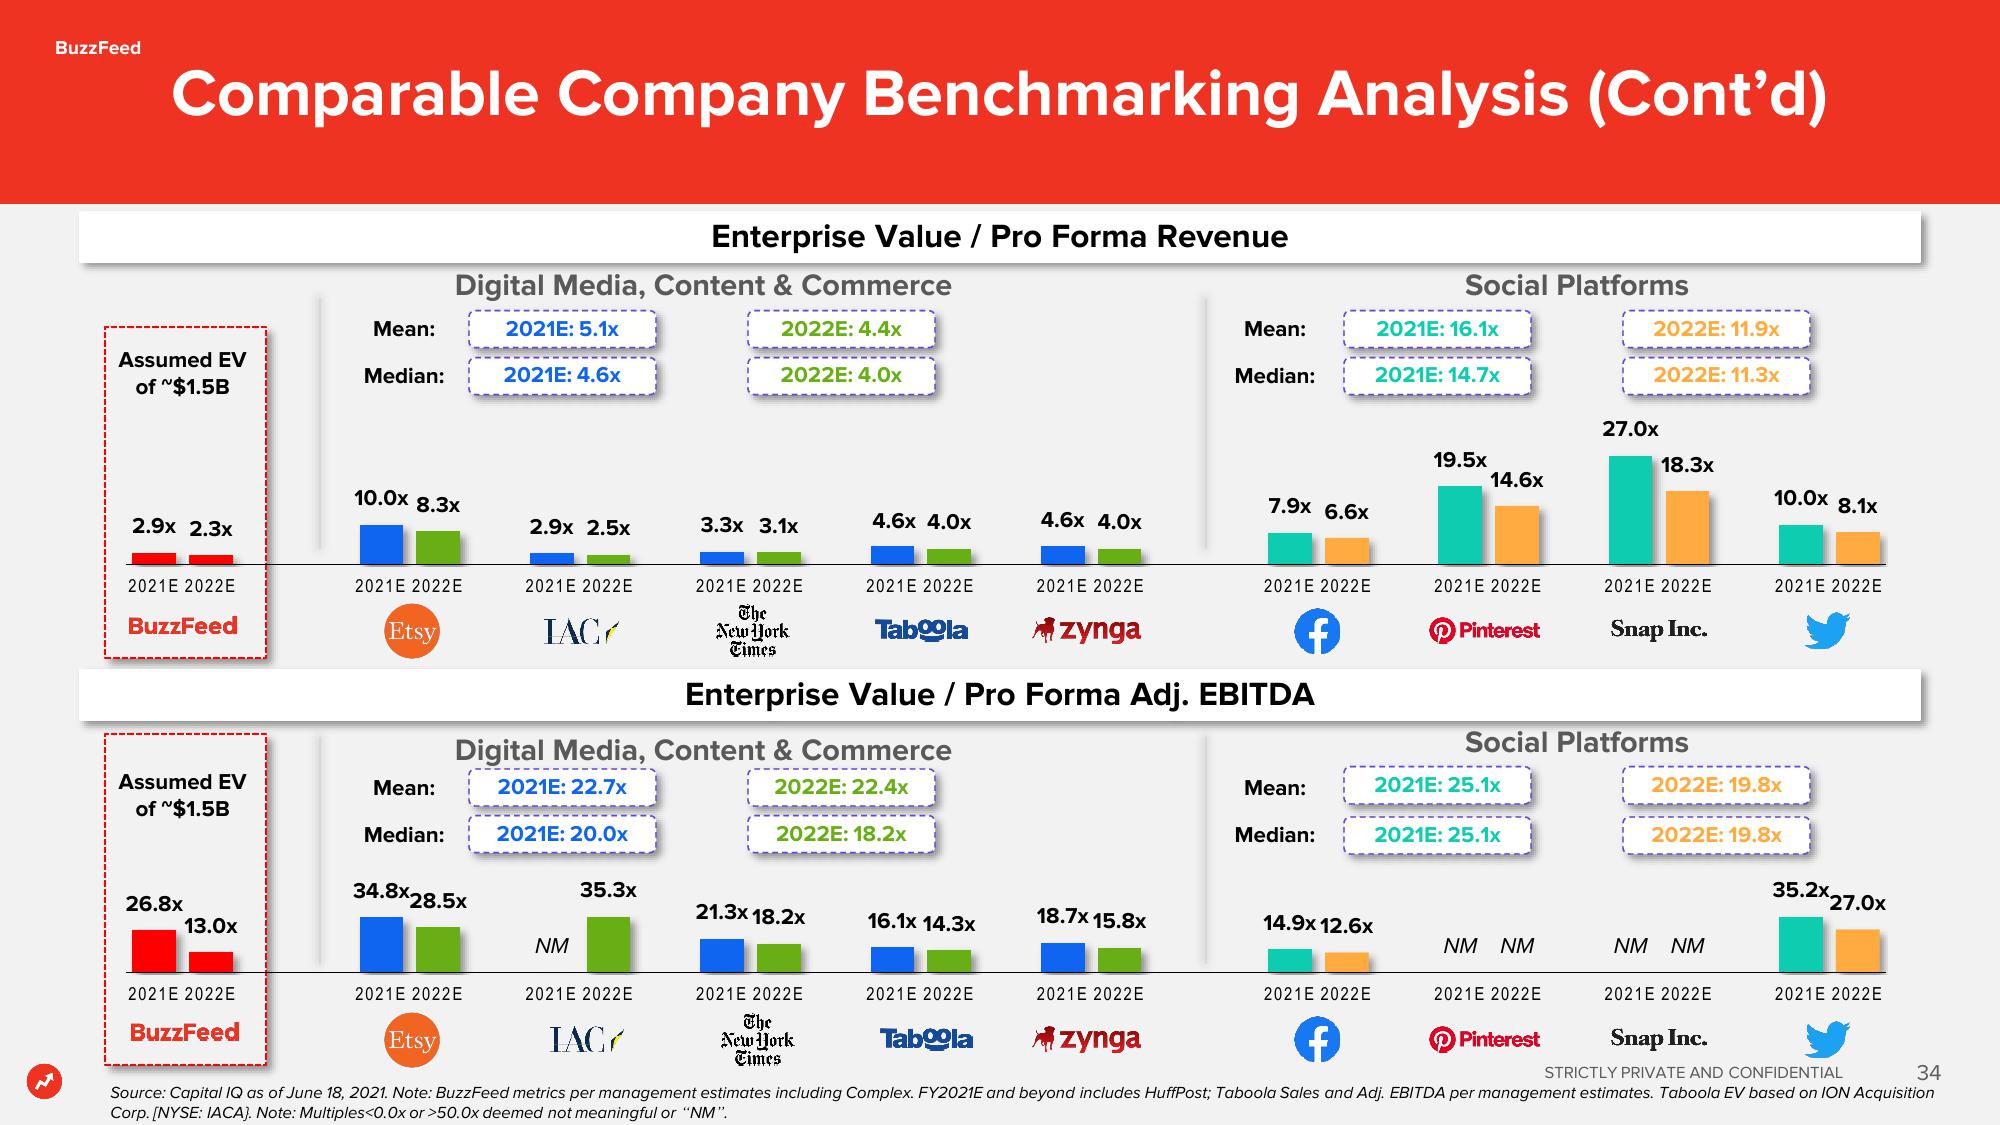
Comparable Company Benchmarking Analysis (Cont'd)
Assumed EV
of $1.5B
2.9x 2.3x
2021E 2022E
BuzzFeed
Assumed EV
of $1.5B
26.8x
13.0x
2021E 2022E
Mean:
BuzzFeed
Median:
10.0x 8.3x
2021E 2022E
Etsy
Mean:
Digital Media, Content & Commerce
2021E: 5.1x
2022E: 4.4x
Median:
34.8x28.5x
2021E: 4.6x
2021 2022E
2.9x 2.5x
2021 2022E
IAC
2021E: 20.0x
NM
Enterprise Value / Pro Forma Revenue
35.3x
2021 2022E
2022E: 4.0x
Digital Media, Content & Commerce
2021E: 22.7x
2022E: 22.4x
2022E: 18.2x
3.3x 3.1x
4.6x 4.0x
21.3x18.2x
2021 E 2022E
2021 2022E
The
New York
Times
2021E 2022E
The
New York
Times
Enterprise Value / Pro Forma Adj. EBITDA
Taboola
16.1x 14.3x
2021E 2022E
4.6x 4.0x
2021E 2022E
Taboola
zynga
18.7x 15.8x
2021E 2022E
Mean:
Median:
7.9x 6.6x
Azynga
2021E 2022E
f
Mean:
Median:
14.9x 12.6x
2021E 2022E
Social Platforms
2021E: 16.1x
2021E: 14.7x
19.5x
14.6x
2021E 2022E
Pinterest
2021E: 25.1x
2021E: 25.1x
NM NM
2021E 2022E
2022E: 11.9x
2022E: 11.3x
Social Platforms
Pinterest
27.0x
18.3x
2021E 2022E
Snap Inc.
2021E 2022E
Etsy
IAC
f
Snap Inc.
STRICTLY PRIVATE AND CONFIDENTIAL
34
Source: Capital IQ as of June 18, 2021. Note: BuzzFeed metrics per management estimates including Complex. FY2021E and beyond includes HuffPost; Taboola Sales and Adj. EBITDA per management estimates. Taboola EV based on ION Acquisition
Corp. [NYSE: IACA). Note: Multiples<0.0x or >50.0x deemed not meaningful or "NM".
10.0x 8.1x
2021E 2022E
2022E: 19.8x
NM NM
2022E: 19.8x
35.2x 27.0x
2021E 2022EView entire presentation