Goldman Sachs Investment Banking Pitch Book
Goldman
Sachs
Wealth Management Fees
% Revenue
Other Revenue
% Revenue
Revenue
% Growth
HoldCo Compensation (excl. non-cash equity comp)
% Growth
% Revenue
Other Compensation (excl. non-cash equity comp)
% Growth
% Revenue
HoldCo SG&A
% Growth
% Revenue
Other SG&A
% Growth
% Revenue
Management Fees
% Growth
% Revenue
Total Expenses
% Revenue
Total Operating Income
Equity Method Earnings & Other Dividends
Adjusted EBITDA
% Revenue
Depreciation and Other Amortization
(Interest Income)
Interest Expense
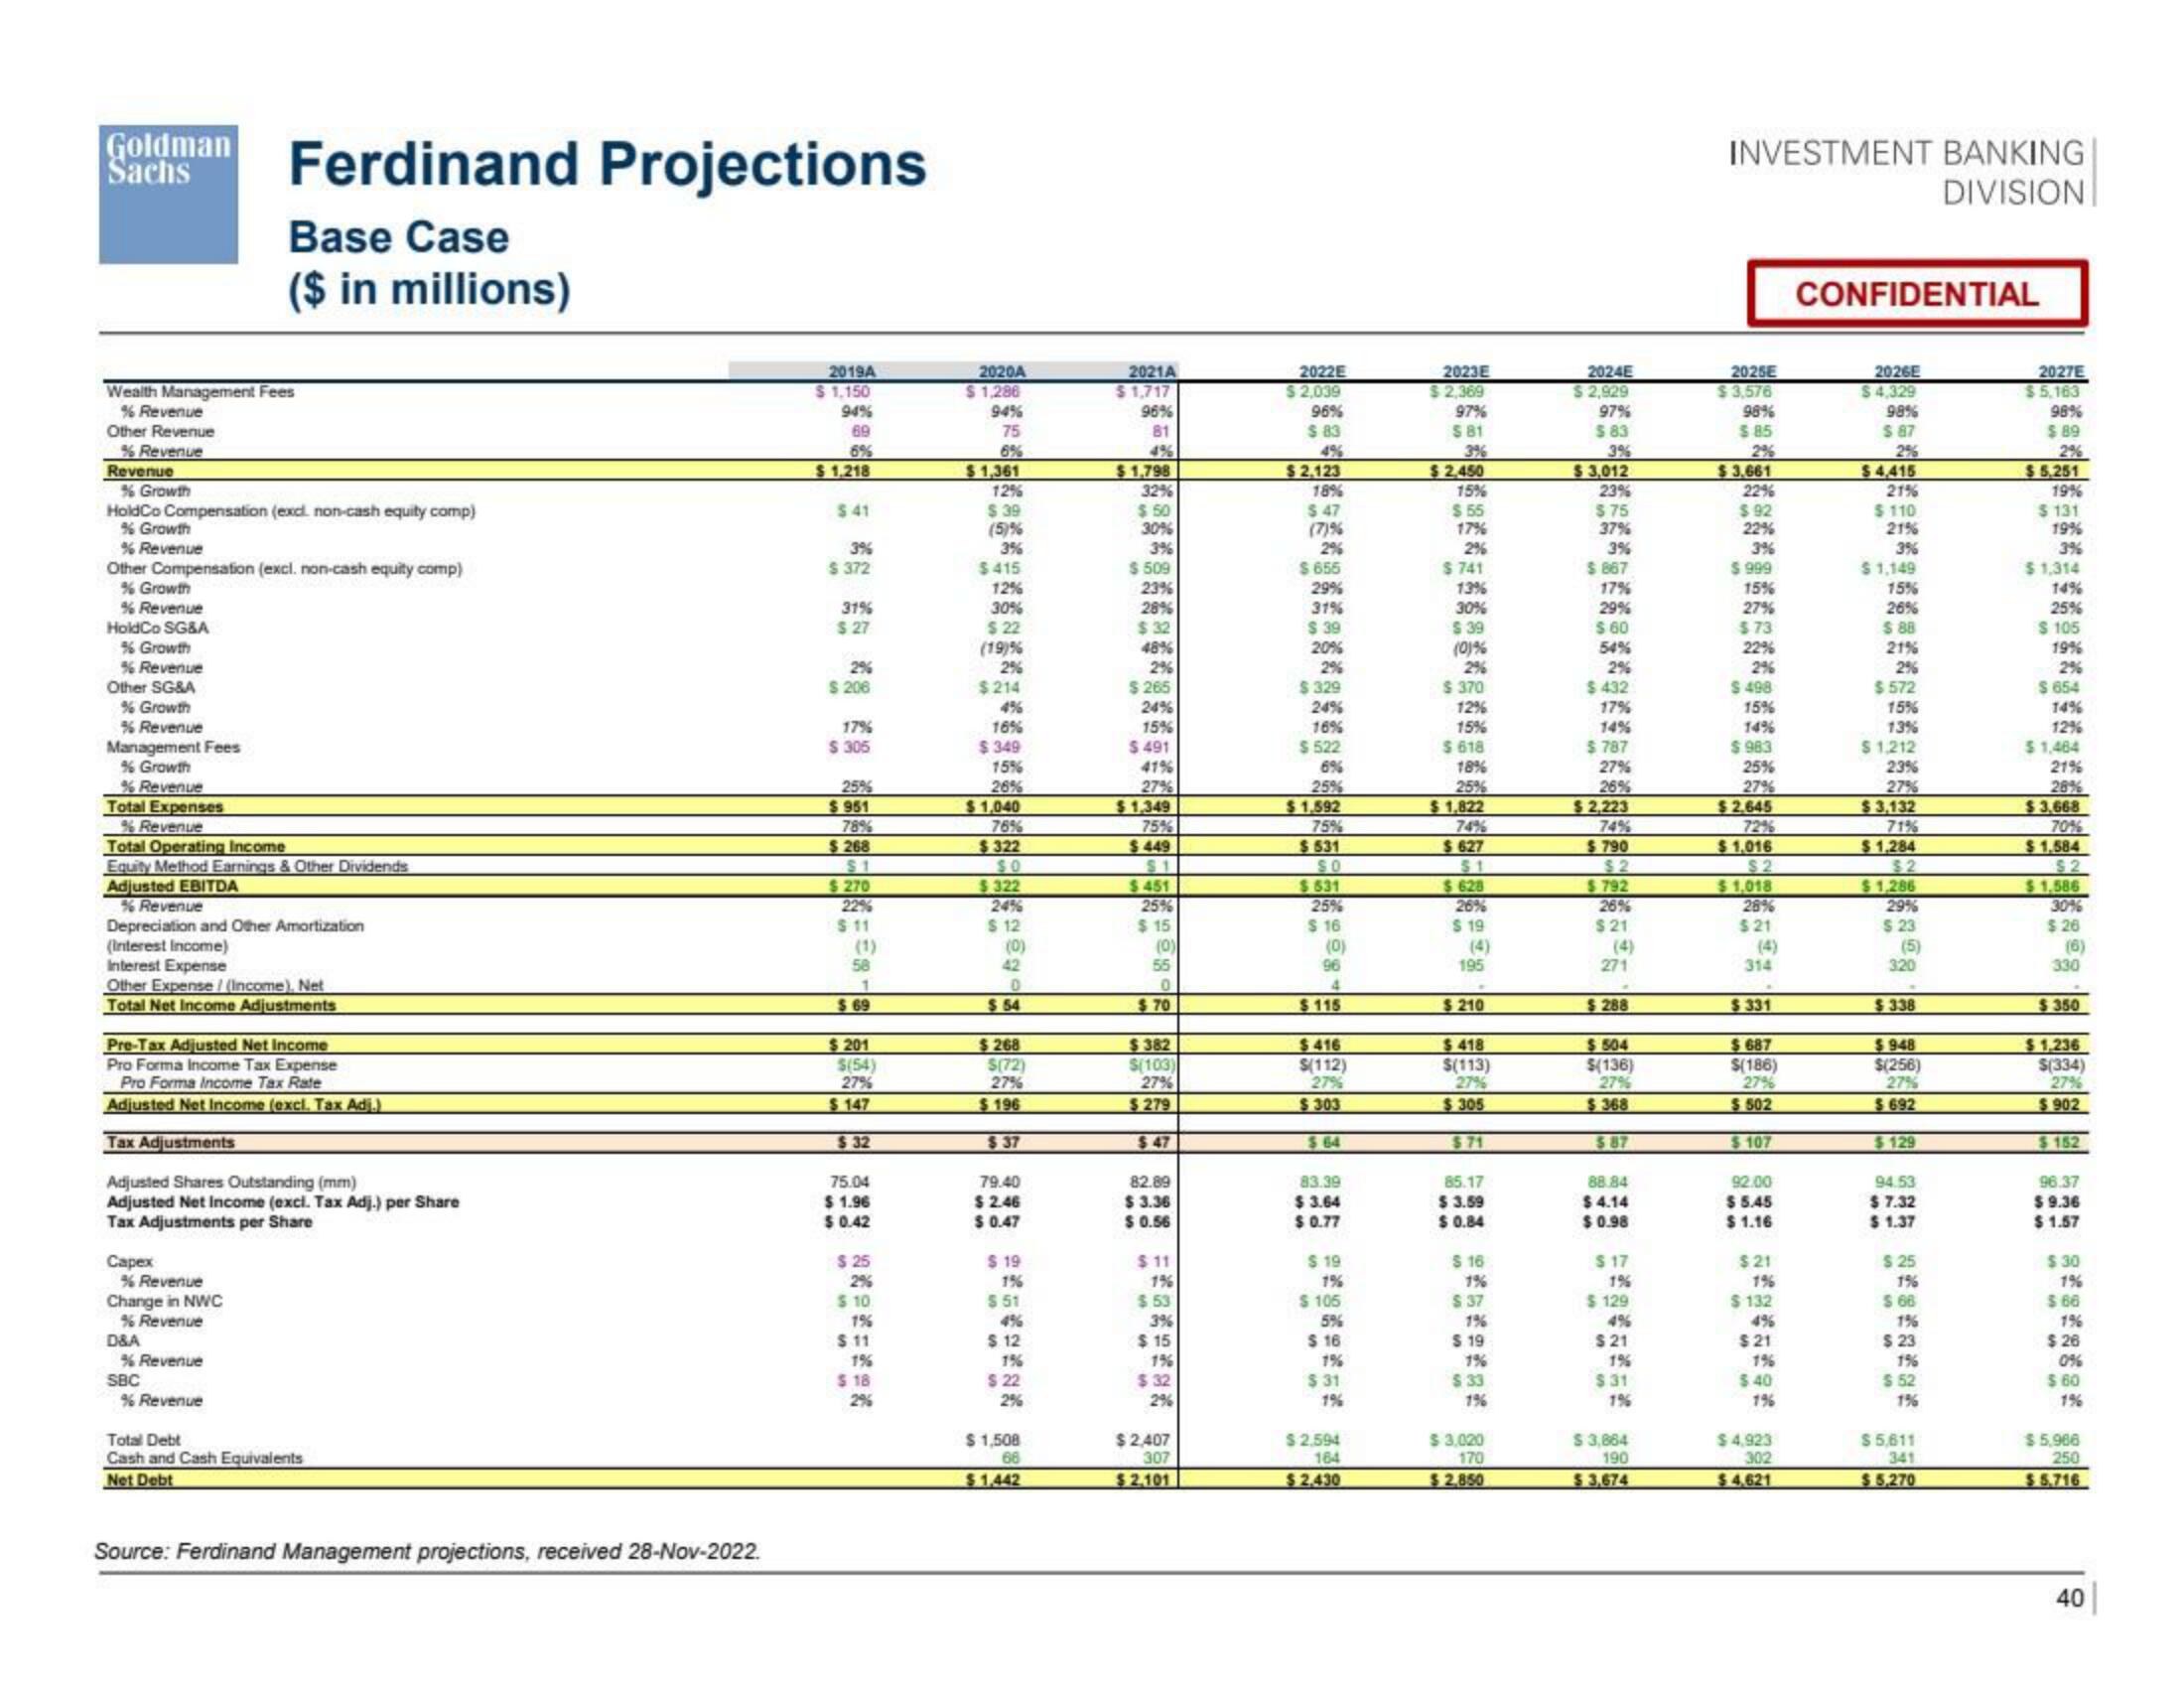
Ferdinand Projections
Base Case
($ in millions)
Other Expense/ (Income). Net
Total Net Income Adjustments
Pre-Tax Adjusted Net Income
Pro Forma Income Tax Expense
Pro Forma Income Tax Rate
Adjusted Net Income (excl. Tax Adj.)
Tax Adjustments
Adjusted Shares Outstanding (mm)
Adjusted Net Income (excl. Tax Adj.) per Share
Tax Adjustments per Share
Capex
% Revenue
Change in NWC
% Revenue
D&A
% Revenue
SBC
% Revenue
Total Debt
Cash and Cash Equivalents
Net Debt
Source: Ferdinand Management projections, received 28-Nov-2022.
2019A
$1,150
94%
69
6%
$1,218
$41
3%
$372
31%
$ 27
2%
$ 206
17%
$ 305
25%
$951
78%
$268
$1
$270
22%
$11
(1)
58
1
$ 69
$ 201
$(54)
27%
$147
$32
75.04
$1.96
$0.42
$25
2%
$ 10
1%
$11
1%
$ 18
2020A
$1,286
94%
75
6%
$1,361
12%
$ 39
(5)%
3%
$415
12%
30%
$22
(19)%
2%
$214
4%
16%
$349
15%
26%
$1,040
76%
$322
$0
$322
24%
$ 12
(0)
42
0
$54
$268
$(72)
27%
$196
$ 37
79.40
$2.46
$ 0.47
$ 19
15
$ 51
4%
$ 12
1%
$ 22
2%
$1,508
66
$1,442
2021A
$1,717
96%
81
4%
$1,798
32%
$50
30%
3%
$ 509
23%
28%
$32
48%
2%
$265
24%
15%
$ 491
41%
27%
$1,349
75%
$449
$451
25%
$15
(0)
55
0
$70
$382
$(103)
27%
$279
$47
82.89
$3.36
$ 0.56
$11
1%
$53
3%
$15
1%
$32
2%
$2,407
307
$2,101
2022E
$2,039
96%
$83
$2.123
18%
$ 47
(7)%
2%
$655
29%
31%
$ 39
20%
2%
$ 329
24%
16%
$522
6%
25%
$1,592
75%
$531
SO
$531
25%
$ 16
(0)
96
4
$115
$416
$(112)
27%
$303
$64
83.39
$3.64
$ 0.77
$ 19
1%
$ 105
5%
$ 16
1%
$ 31
$2.594
164
$2.430
2023E
$2,369
97%
$ 81
3%
$2,450
15%
$55
17%
2%
$741
13%
30%
$39
(0)%
2%
$ 370
12%
15%
$ 618
18%
25%
$1,822
74%
$627
$1
$628
26%
$ 19
195
$210
$418
$(113)
27%
$305
$71
85.17
$ 3.59
$ 0.84
$ 16
1%
$ 37
1%
$ 19
1%
$.33
$3,020
170
$2,850
2024E
$2,929
97%
$ 83
3%
$3,012
23%
$75
37%
3%
$ 867
17%
29%
$ 60
54%
2%
$432
17%
14%
$787
27%
26%
$2,223
74%
$790
$2
$792
26%
$21
271
$288
$504
$(136)
27%
$368
$ 87
88.84
$4.14
$0.98
$17
1%
$129
$21
1%
$31
1%
$ 3,864
190
$3,674
INVESTMENT BANKING
DIVISION
2025E
$3,576
98%
$85
2%
$3.661
22%
$92
22%
3%
$ 999
15%
27%
$73
22%
2%
$ 498
15%
14%
$ 983
25%
27%
$2.645
72%
$1,016
$2
$1,018
28%
$21
314
$331
$687
$(186)
27%
$ 502
$107
92.00
$5.45
$ 1.16
$21
1%
$ 132
$21
$40
1%
$4,923
302
$4,621
CONFIDENTIAL
2026E
$4,329
98%
$ 87
2%
$4,415
21%
$ 110
21%
3%
$1,149
15%
26%
$ 88
21%
2%
$572
15%
13%
$1,212
23%
27%
$3,132
71%
$1,284
$2
$1,286
29%
$ 23
(5)
320
$338
$948
$(256)
27%
$692
$129
94.53
$ 7.32
$1.37
$ 25
1%
$ 66
1%
$ 23
1%
$ 52
1%
$5,611
341
$5,270
2027E
$5,163
98%
$ 89
2%
$5,251
19%
$ 131
19%
3%
$1,314
14%
25%
$ 105
19%
2%
$ 654
14%
12%
$1,464
21%
28%
$3,668
70%
$1,584
$2
$1,586
30%
$26
(6)
330
$350
$1,236
$(334)
27%
$902
$152
96.37
$9.36
$1.57
$30
$ 66
$26
0%
$ 60
1%
$5,966
250
$5,716
40View entire presentation