jetBlue Results Presentation Deck
EXPECT TO CONTINUE DISCIPLINED COST MANAGEMENT TO AID RECOVERY
jetBlue
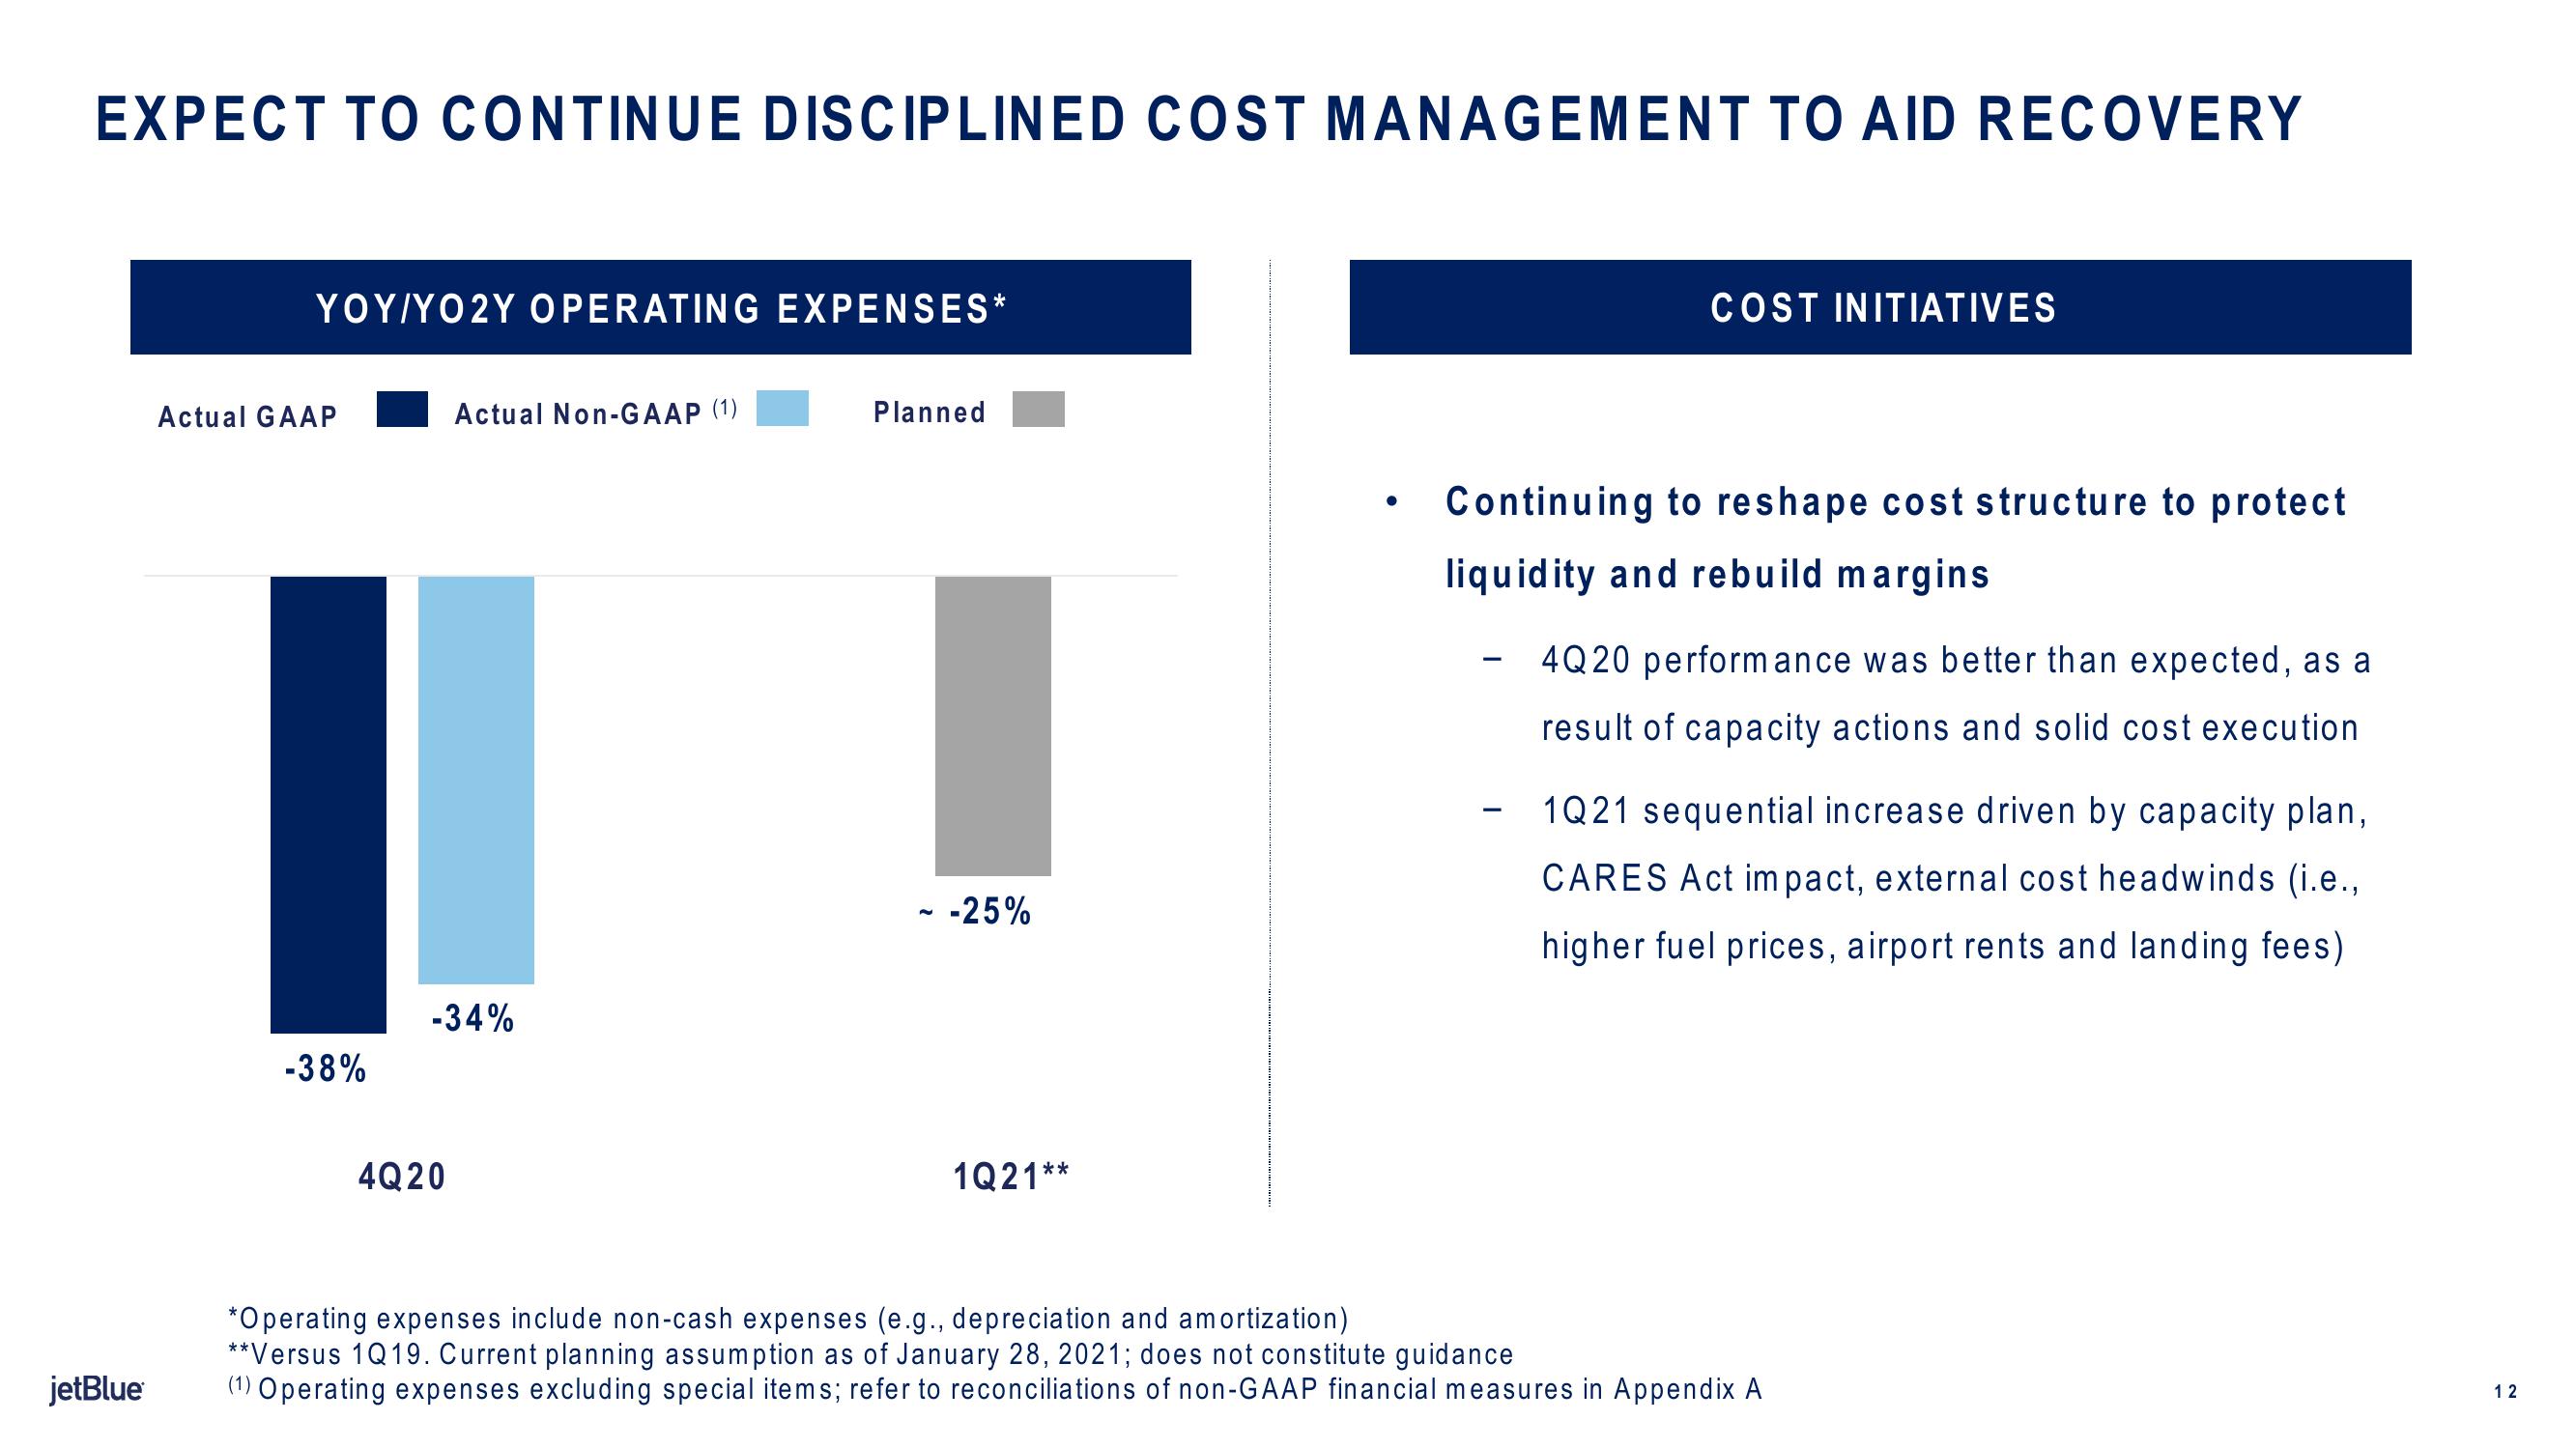
YOY/YO2Y OPERATING EXPENSES*
Actual GAAP
-38%
Actual Non-GAAP (1)
-34%
4Q20
Planned
- -25%
1Q21**
●
COST INITIATIVES
Continuing to reshape cost structure to protect
liquidity and rebuild margins
4Q20 performance was better than expected, as a
result of capacity actions and solid cost execution
1Q21 sequential increase driven by capacity plan,
CARES Act impact, external cost headwinds (i.e.,
higher fuel prices, airport rents and landing fees)
*Operating expenses include non-cash expenses (e.g., depreciation and amortization)
**Versus 1Q19. Current planning assumption as of January 28, 2021; does not constitute guidance
(1) Operating expenses excluding special items; refer to reconciliations of non-GAAP financial measures in Appendix A
12View entire presentation