Investor Presentation
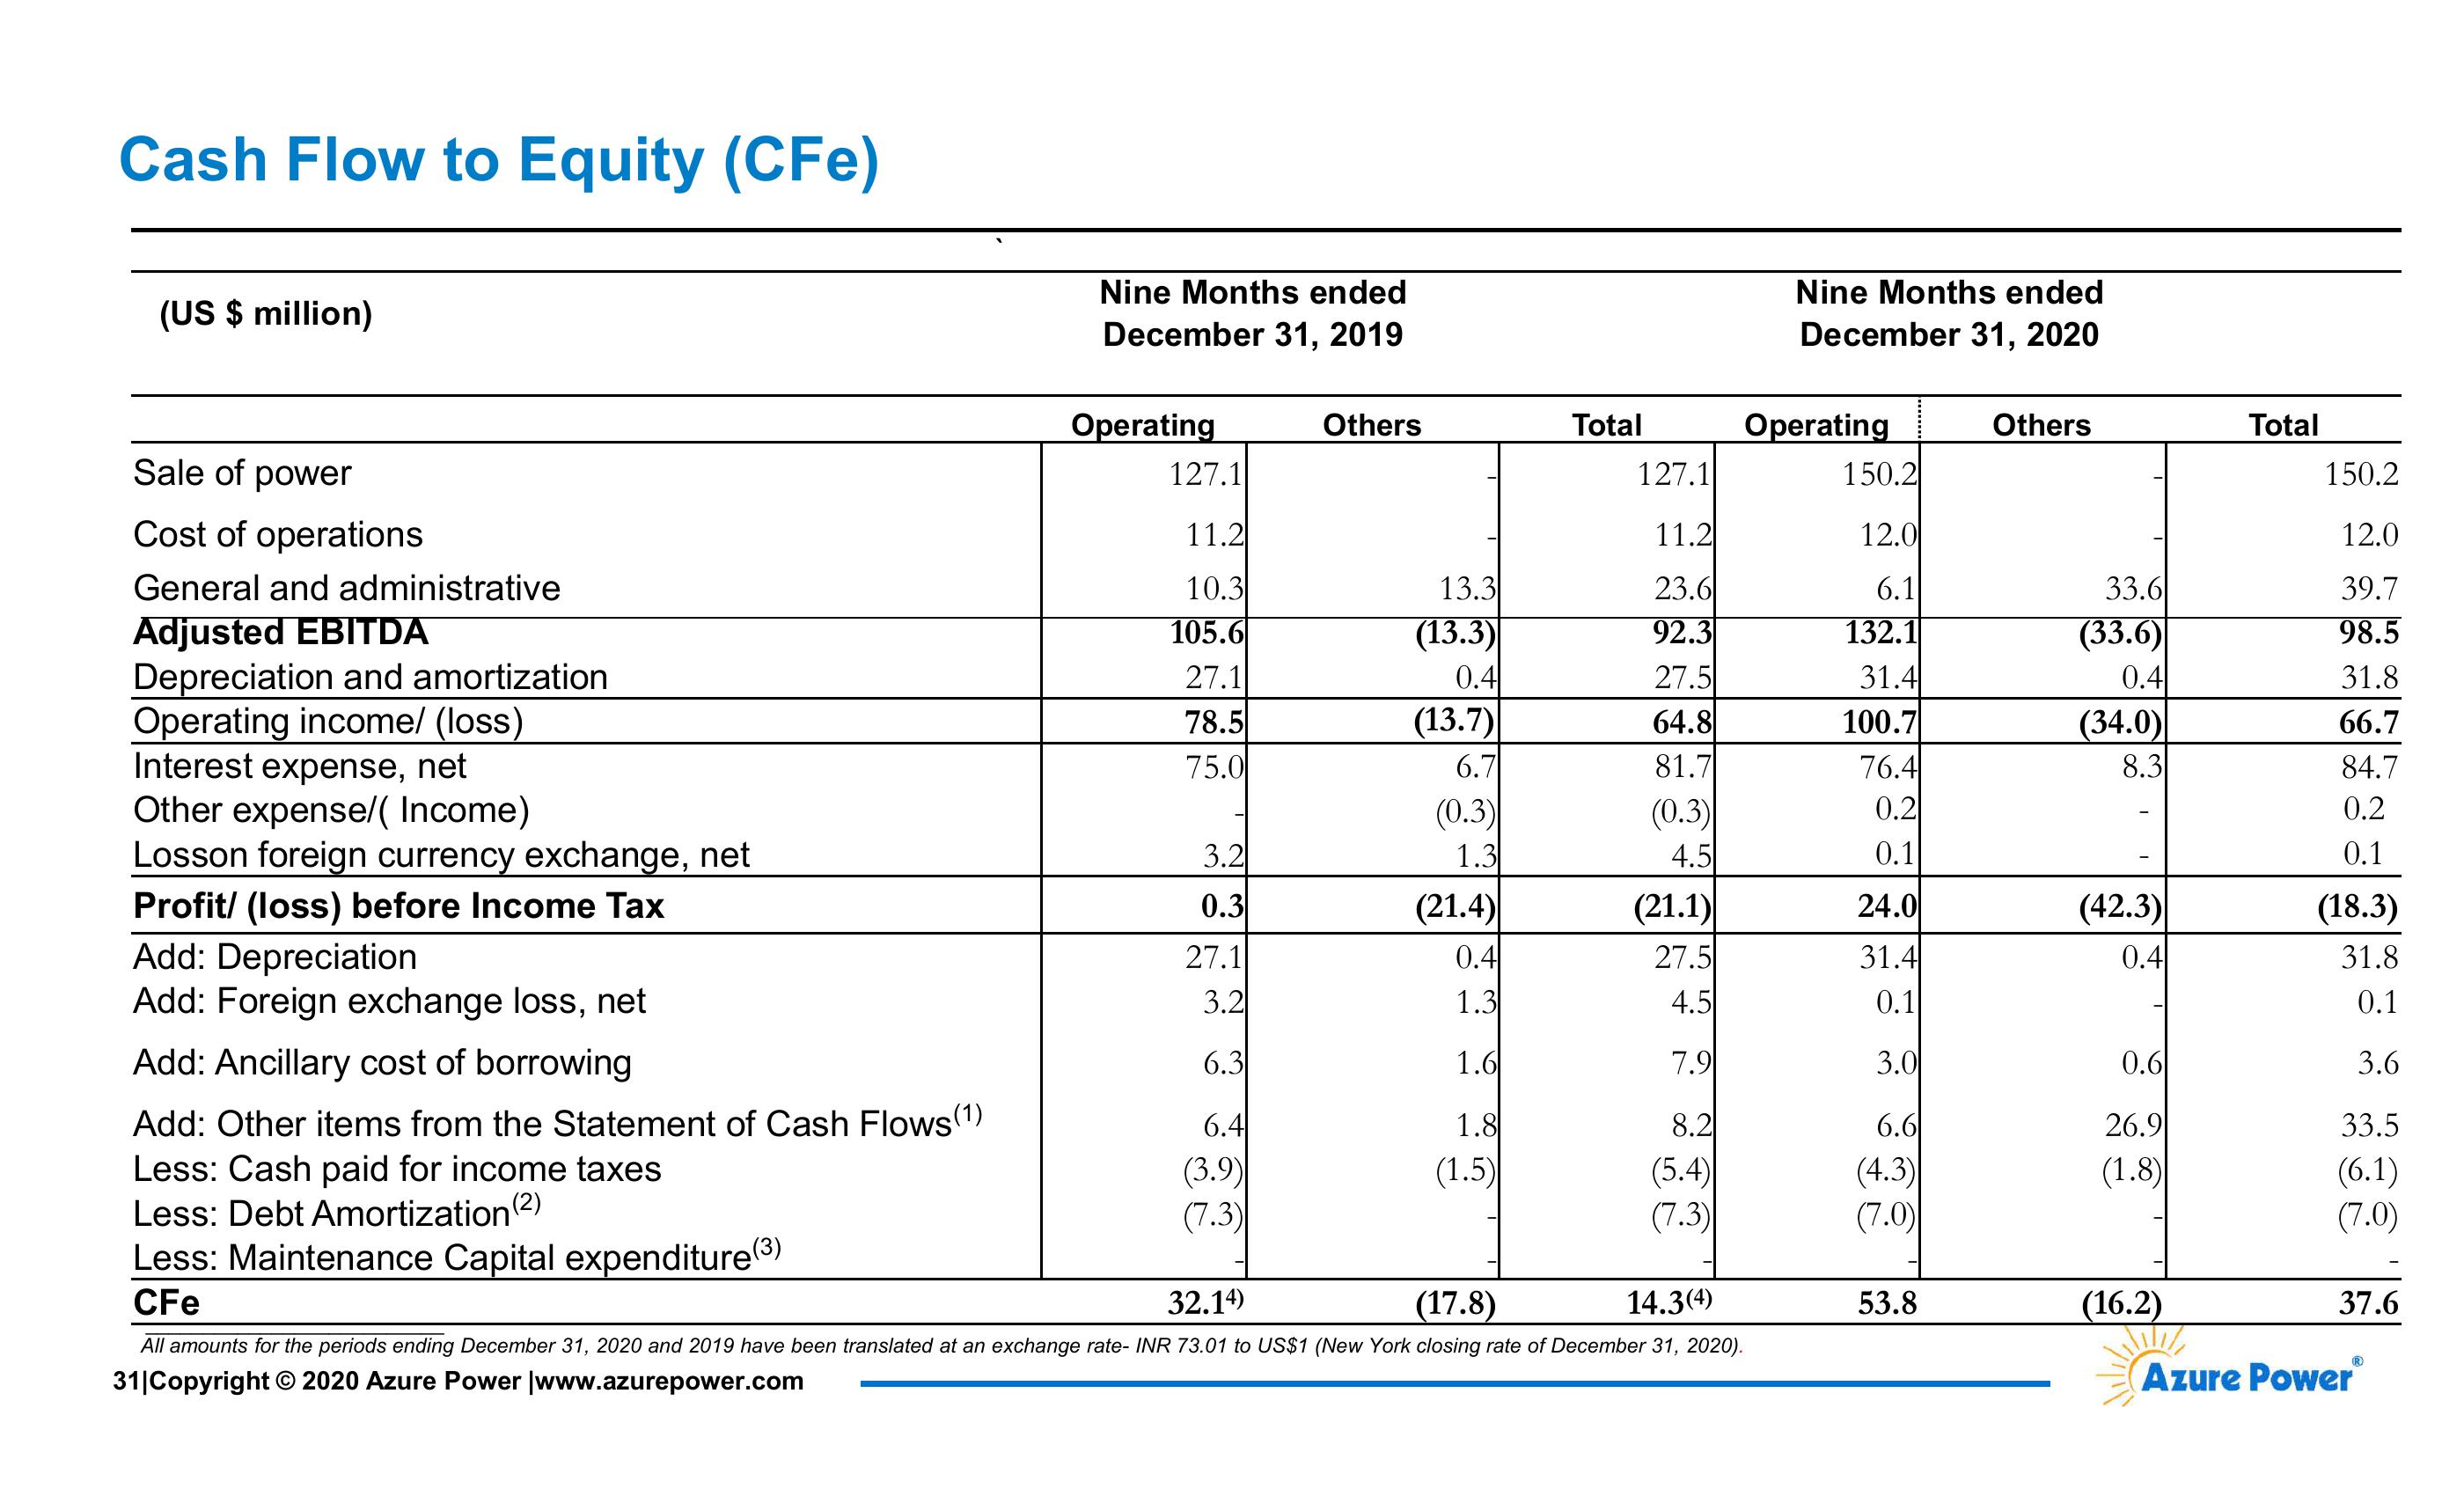
Cash Flow to Equity (CFe)
(US $ million)
Nine Months ended
December 31, 2019
Nine Months ended
December 31, 2020
Operating
Others
Total
Operating
Others
Total
Sale of power
Cost of operations
General and administrative
Adjusted EBITDA
Depreciation and amortization
127.1
127.1
150.2
150.2
11.2
11.2
12.0
12.0
10.3
13.3
23.6
6.1
33.6
39.7
105.6
(13.3)
92.3
132.1
(33.6)
98.5
27.1
0.4
27.5
31.4
0.4
31.8
Operating income/ (loss)
78.5
(13.7)
64.8
100.7
(34.0)
66.7
Interest expense, net
75.0
6.7
81.7
76.4
8.3
84.7
Other expense/( Income)
(0.3)
(0.3)
0.2
0.2
Losson foreign currency exchange, net
3.2
1.3
4.5
0.1
0.1
Profit/(loss) before Income Tax
0.3
(21.4)
(21.1)
24.0
(42.3)
(18.3)
Add: Depreciation
27.1
0.4
27.5
31.4
0.4
31.8
Add: Foreign exchange loss, net
3.2
1.3
4.5
0.1
0.1
Add: Ancillary cost of borrowing
6.3
1.6
7.9
3.0
0.6
3.6
Add: Other items from the Statement of Cash Flows (1)
6.4
1.8
8.2
6.6
26.9
33.5
Less: Cash paid for income taxes
(3.9)
(1.5)
(5.4)
(4.3)
(1.8)
(6.1)
Less: Debt Amortization (2)
(7.3)
(7.3)
(7.0)
(7.0)
Less: Maintenance Capital expenditure (3)
CFe
32.14)
(17.8)
14.3(4)
53.8
(16.2)
37.6
All amounts for the periods ending December 31, 2020 and 2019 have been translated at an exchange rate- INR 73.01 to US$1 (New York closing rate of December 31, 2020).
31|Copyright © 2020 Azure Power |www.azurepower.com
®
Azure PowerⓇView entire presentation