Inovalon Results Presentation Deck
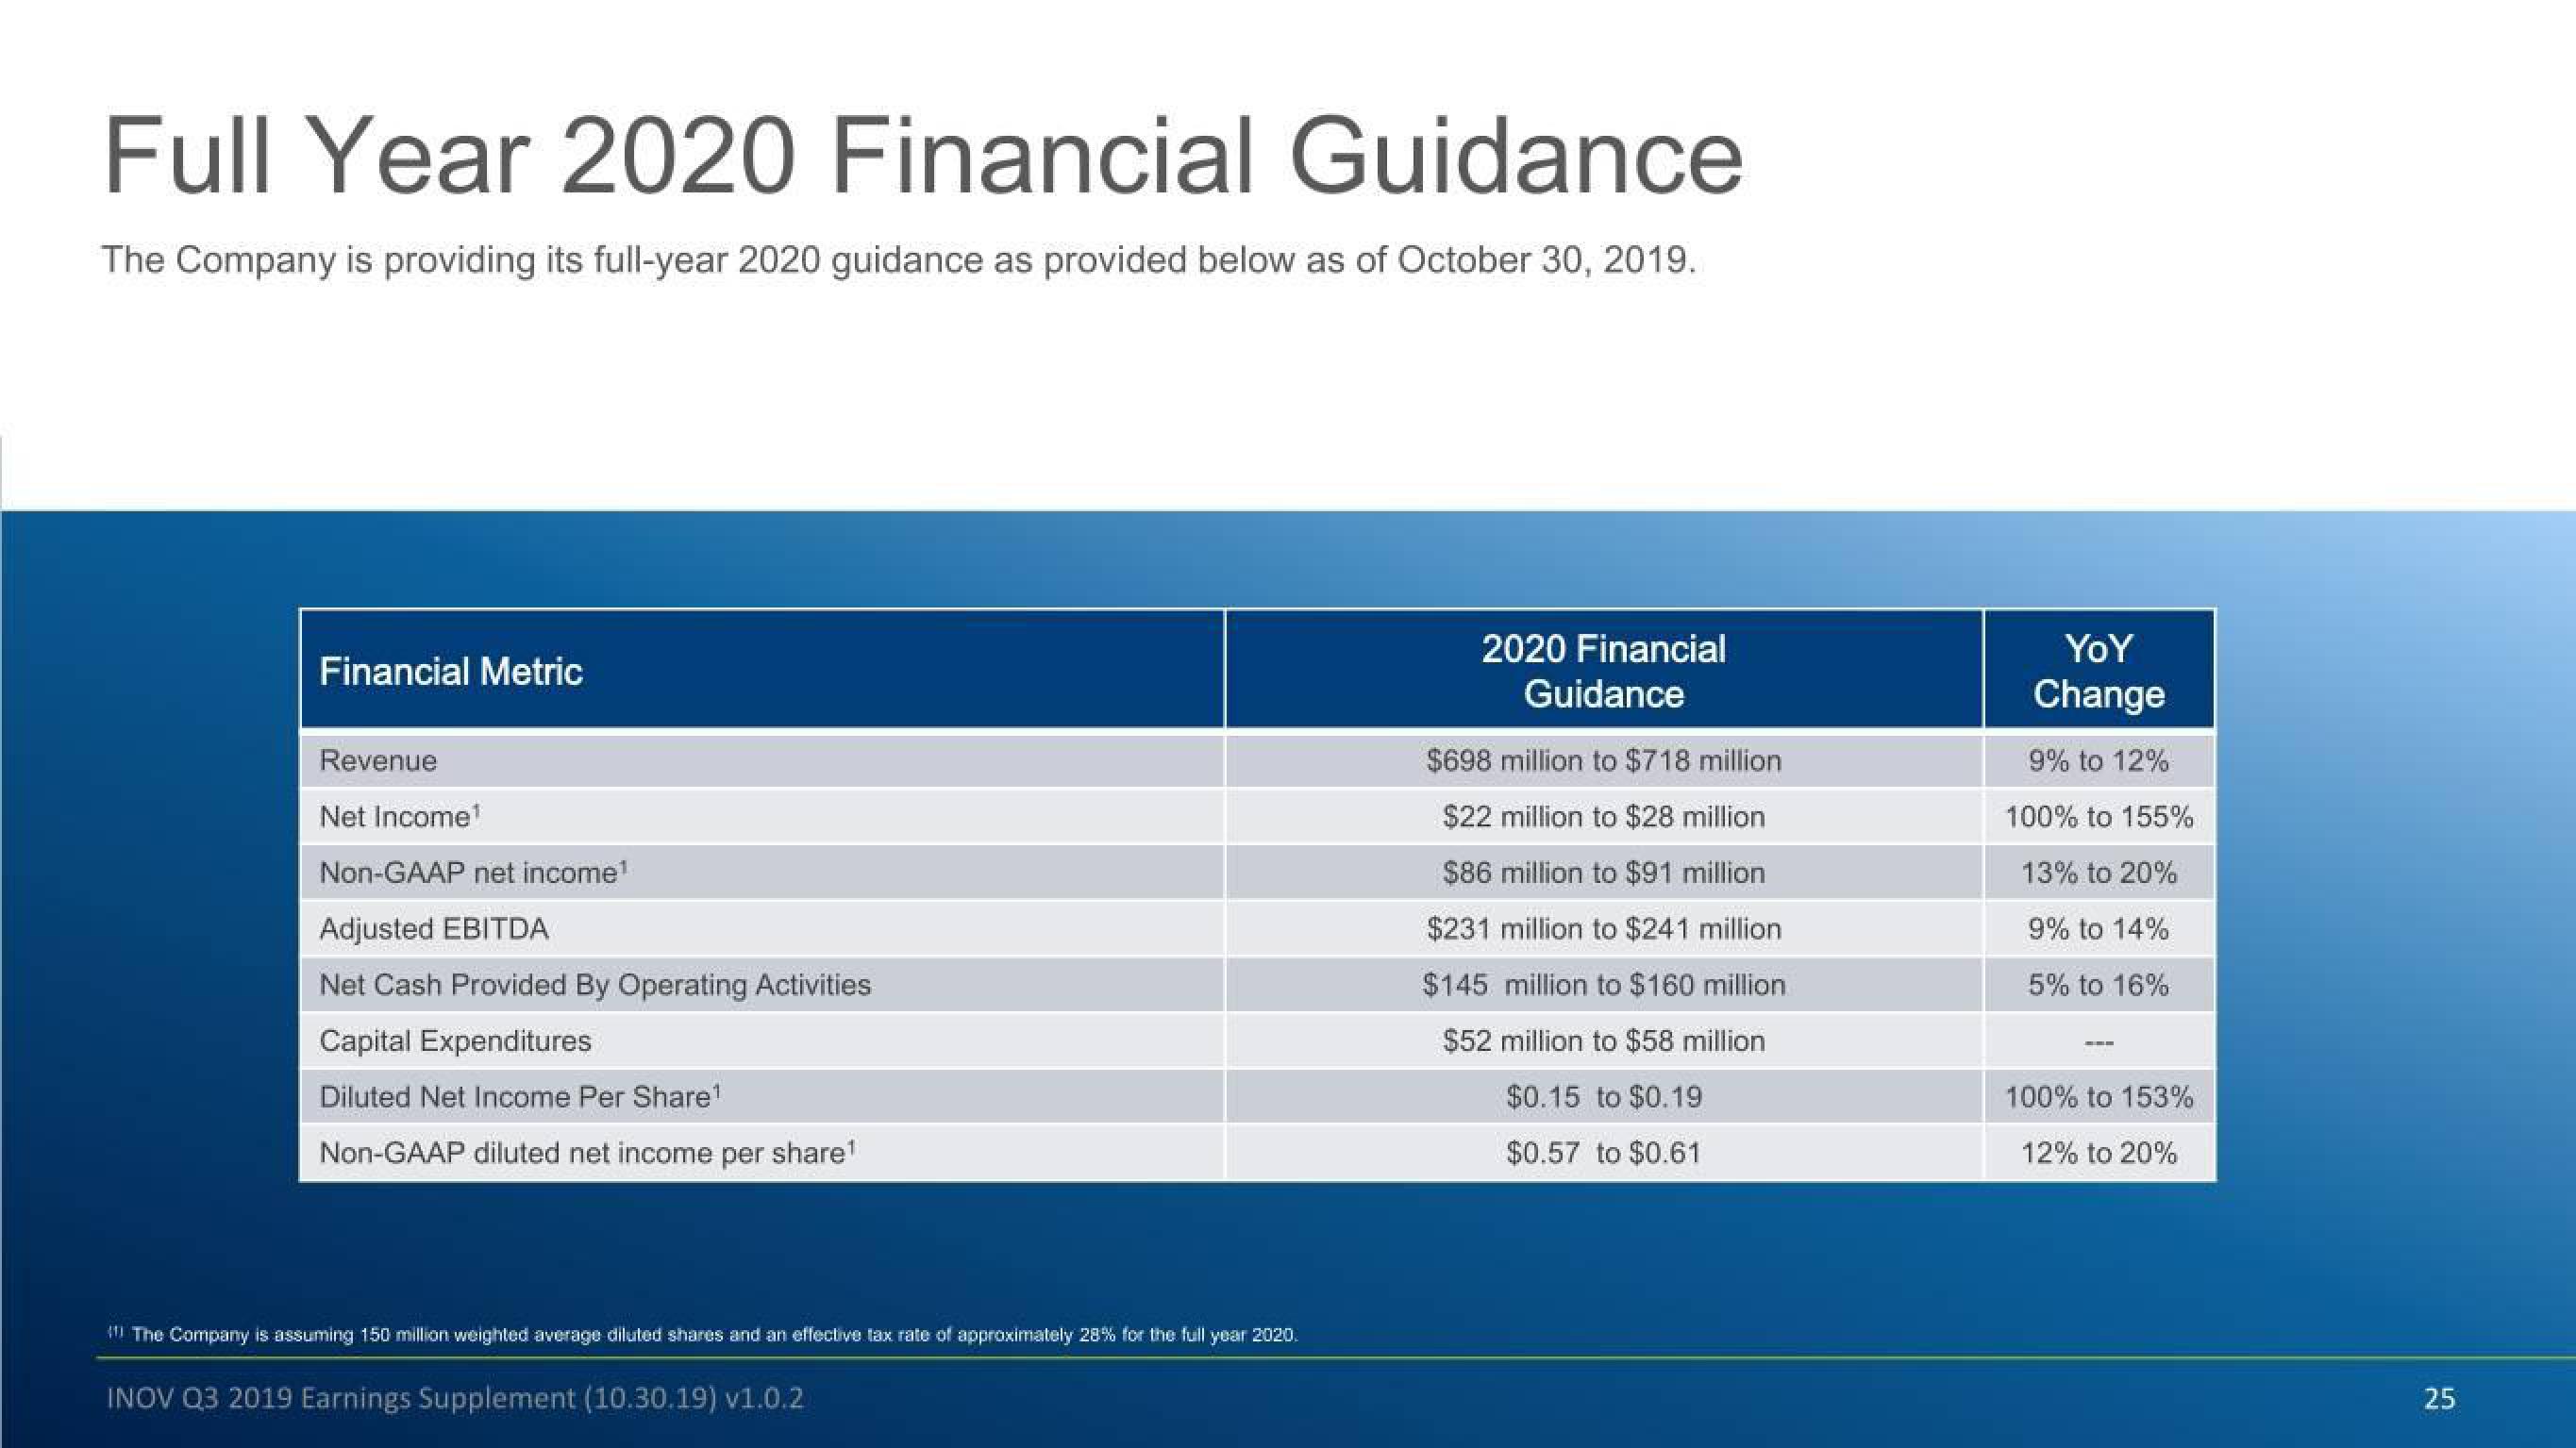
Full Year 2020 Financial Guidance
The Company is providing its full-year 2020 guidance as provided below as of October 30, 2019.
Financial Metric
Revenue
Net Income¹
Non-GAAP net income¹
Adjusted EBITDA
Net Cash Provided By Operating Activities
Capital Expenditures
Diluted Net Income Per Share¹
Non-GAAP diluted net income per share¹
The Company is assuming 150 million weighted average diluted shares and an effective tax rate of approximately 28% for the full year 2020.
INOV Q3 2019 Earnings Supplement (10.30.19) v1.0.2
2020 Financial
Guidance
$698 million to $718 million
$22 million to $28 million
$86 million to $91 million
$231 million to $241 million
$145 million to $160 million
$52 million to $58 million
$0.15 to $0.19
$0.57 to $0.61
YoY
Change
9% to 12%
100% to 155%
13% to 20%
9% to 14%
5% to 16%
100% to 153%
12% to 20%
25View entire presentation