WeWork Investor Day Presentation Deck
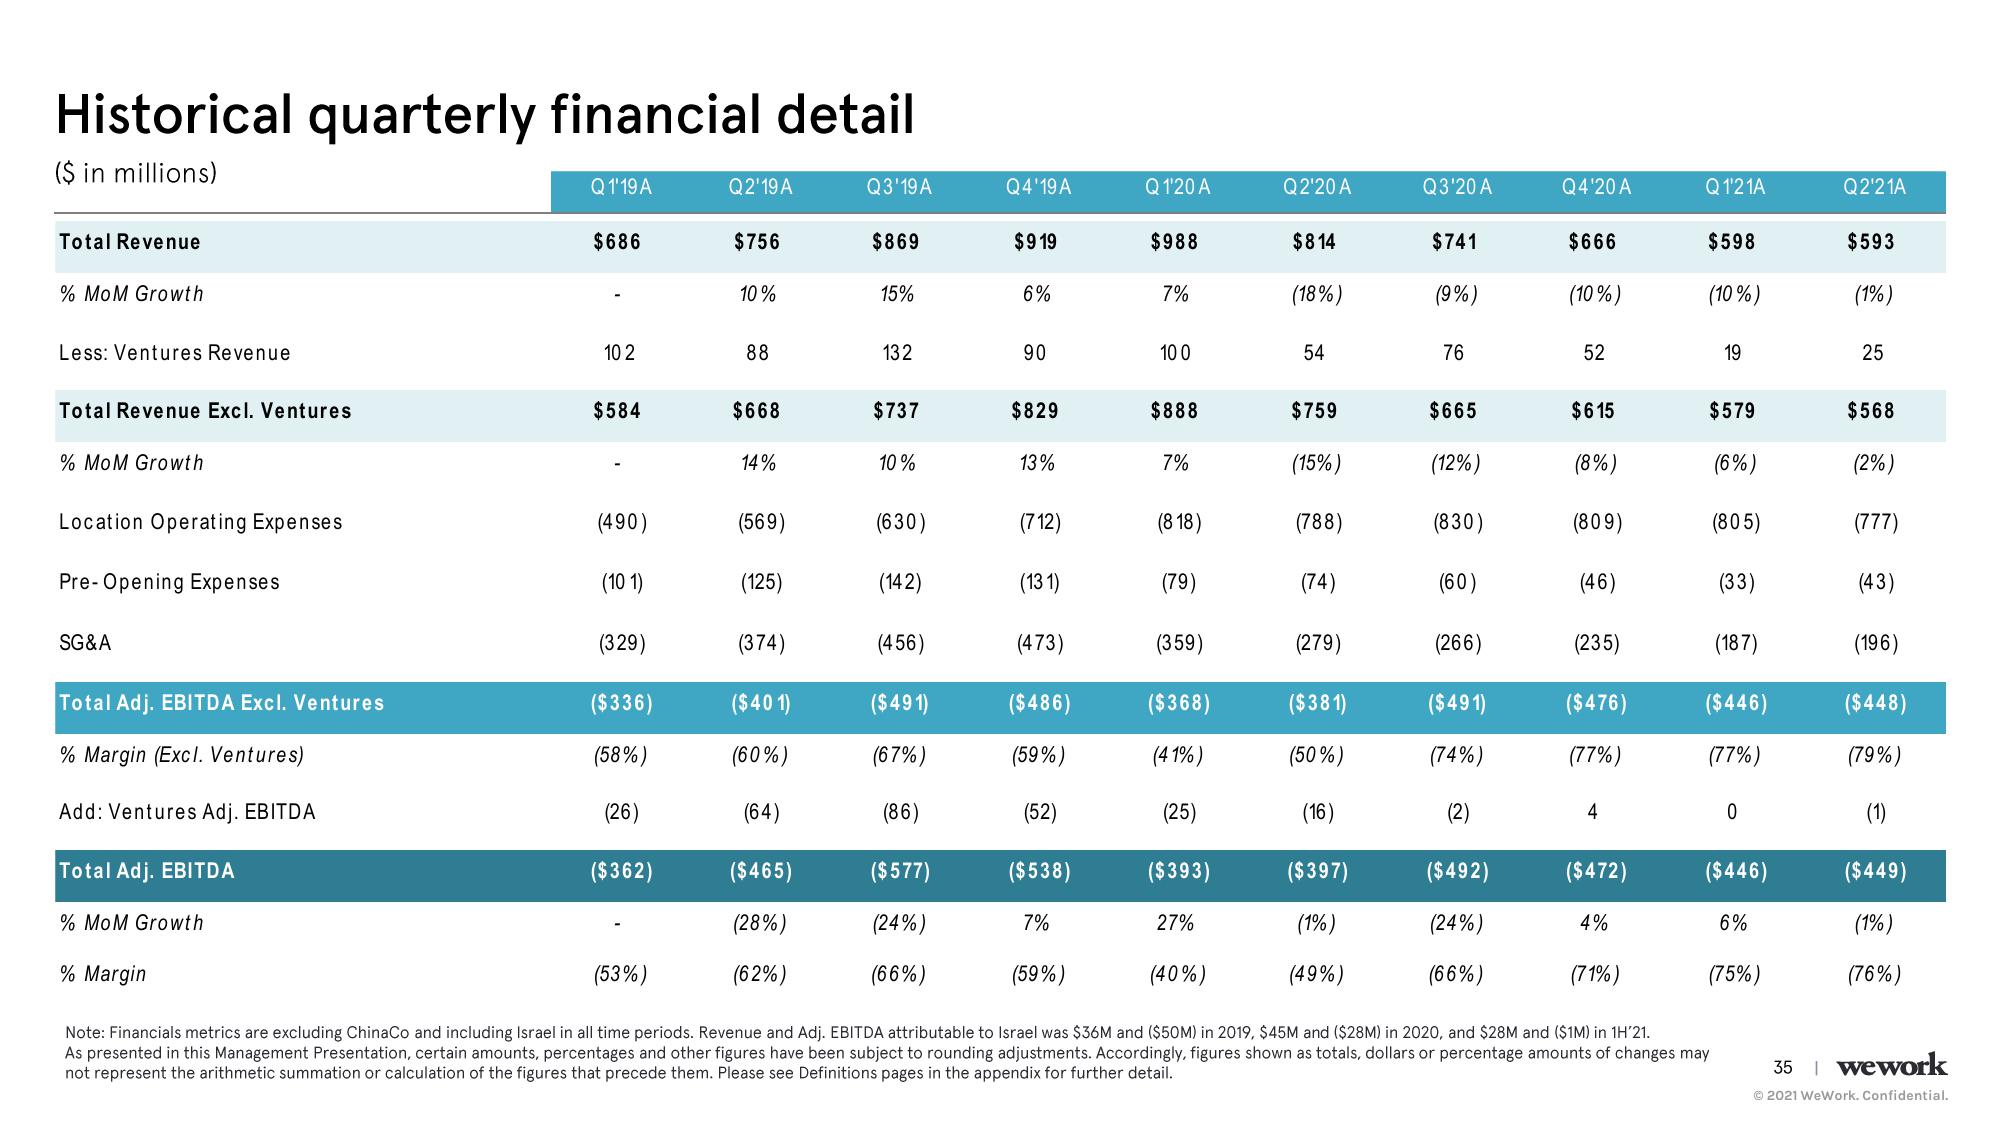
Historical quarterly financial detail
($ in millions)
Total Revenue
% MoM Growth
Less: Ventures Revenue
Total Revenue Excl. Ventures
% MoM Growth
Location Operating Expenses
Pre-Opening Expenses
SG&A
Total Adj. EBITDA Excl. Ventures
% Margin (Excl. Ventures)
Add: Ventures Adj. EBITDA
Total Adj. EBITDA
% MoM Growth
% Margin
Q1'19 A
$686
10 2
$584
(490)
(101)
(329)
($336)
(58%)
(26)
($362)
(53%)
Q2'19 A
$756
10%
88
$668
14%
(569)
(125)
(374)
($401)
(60%)
(64)
($465)
(28%)
(62%)
Q3'19 A
$869
15%
132
$737
10%
(630)
(142)
(456)
($491)
(67%)
(86)
($577)
(24%)
(66%)
Q4'19 A
$919
6%
90
$829
13%
(712)
(131)
(473)
($486)
(59%)
(52)
($538)
7%
(59%)
Q1'20 A
$988
7%
10 0
$888
(818)
(79)
(359)
($368)
(41%)
(25)
($393)
27%
Q2'20 A
$814
(18%)
54
$759
(15%)
(788)
(74)
(279)
($381)
(50%)
(16)
($397)
(1%)
(49%)
Q3'20 A
$741
(9%)
76
$665
(12%)
(830)
(60)
(266)
($491)
(74%)
(2)
($492)
(24%)
(66%)
Q4'20 A
$666
(10%)
52
$615
(8%)
(809)
(46)
(235)
($476)
(77%)
4
($472)
4%
(71%)
Q1'21A
$598
(10%)
19
$579
(6%)
(805)
(33)
(187)
($446)
(77%)
(40%)
Note: Financials metrics are excluding ChinaCo and including Israel in all time periods. Revenue and Adj. EBITDA attributable to Israel was $36M and ($50M) in 2019, $45M and ($28M) in 2020, and $28M and ($1M) in 1H'21.
As presented in this Management Presentation, certain amounts, percentages and other figures have been subject to rounding adjustments. Accordingly, figures shown as totals, dollars or percentage amounts of changes may
not represent the arithmetic summation or calculation of the figures that precede them. Please see Definitions pages in the appendix for further detail.
0
($446)
6%
(75%)
Q2'21A
$593
(1%)
25
$568
(2%)
(777)
(43)
(196)
($448)
(79%)
(1)
($449)
(1%)
(76%)
35 | wework
Ⓒ2021 WeWork. Confidential.View entire presentation