Metals Acquisition Corp SPAC Presentation Deck
A
1 Significant Cost Reduction Potential and Stable Production Profile
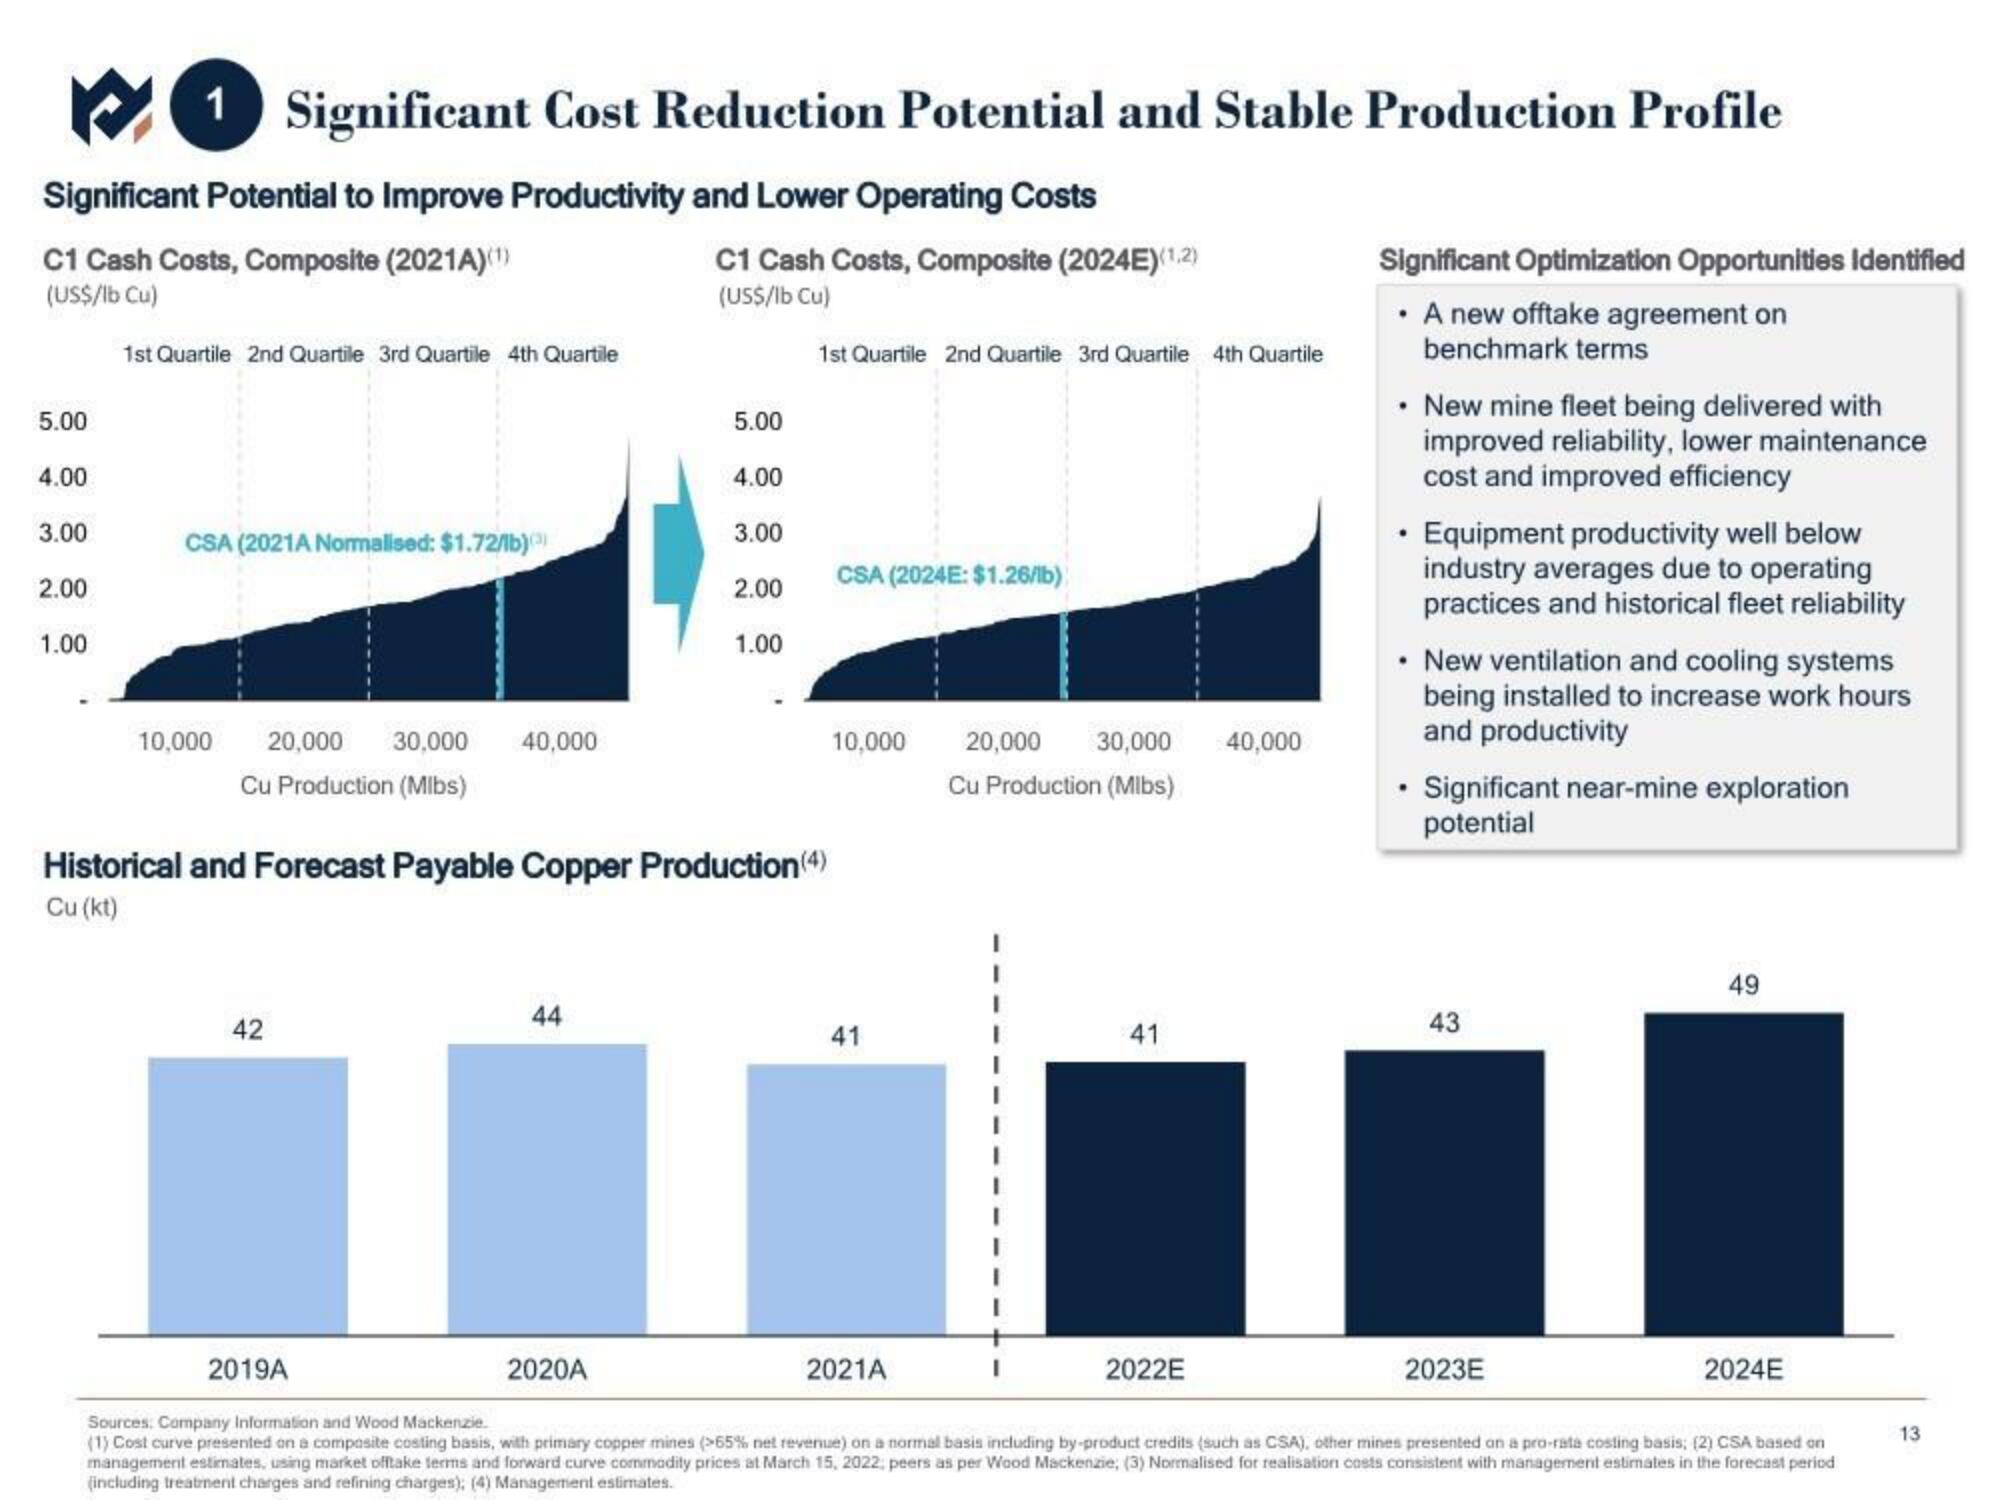
Significant Potential to Improve Productivity and Lower Operating Costs
C1 Cash Costs, Composite (2021A)(¹)
(US$/lb Cu)
5.00
4.00
3.00
2.00
1.00
1st Quartile 2nd Quartile 3rd Quartile 4th Quartile
CSA (2021A Normalised: $1.72/lb)()
10,000 20,000 30,000 40,000
Cu Production (Mlbs)
42
44
C1 Cash Costs, Composite (2024E)(1.2)
(US$/lb Cu)
2020A
5.00
4.00
3.00
2.00
1.00
Historical and Forecast Payable Copper Production (4)
Cu (kt)
1st Quartile 2nd Quartile 3rd Quartile 4th Quartile
CSA (2024E: $1.26/lb)
10,000
41
2021A
20,000
30,000
Cu Production (Mlbs)
41
2022E
40,000
Significant Optimization Opportunities Identified
• A new offtake agreement on
benchmark terms
• New mine fleet being delivered with
improved reliability, lower maintenance
cost and improved efficiency
• Equipment productivity well below
industry averages due to operating
practices and historical fleet reliability
• New ventilation and cooling systems
being installed to increase work hours
and productivity
• Significant near-mine exploration
potential
2019A
Sources: Company Information and Wood Mackenzie.
(1) Cost curve presented on a composite costing basis, with primary copper mines (>65% net revenue) on a normal basis including by-product credits (such as CSA), other mines presented on a pro-rata costing basis; (2) CSA based on
management estimates, using market offtake terms and forward curve commodity prices at March 15, 2022, peers as per Wood Mackenzie; (3) Normalised for realisation costs consistent with management estimates in the forecast period
(including treatment charges and refining charges); (4) Management estimates.
43
2023E
49
2024E
13View entire presentation