BAT Results Presentation Deck slide image

BAT Results Presentation Deck

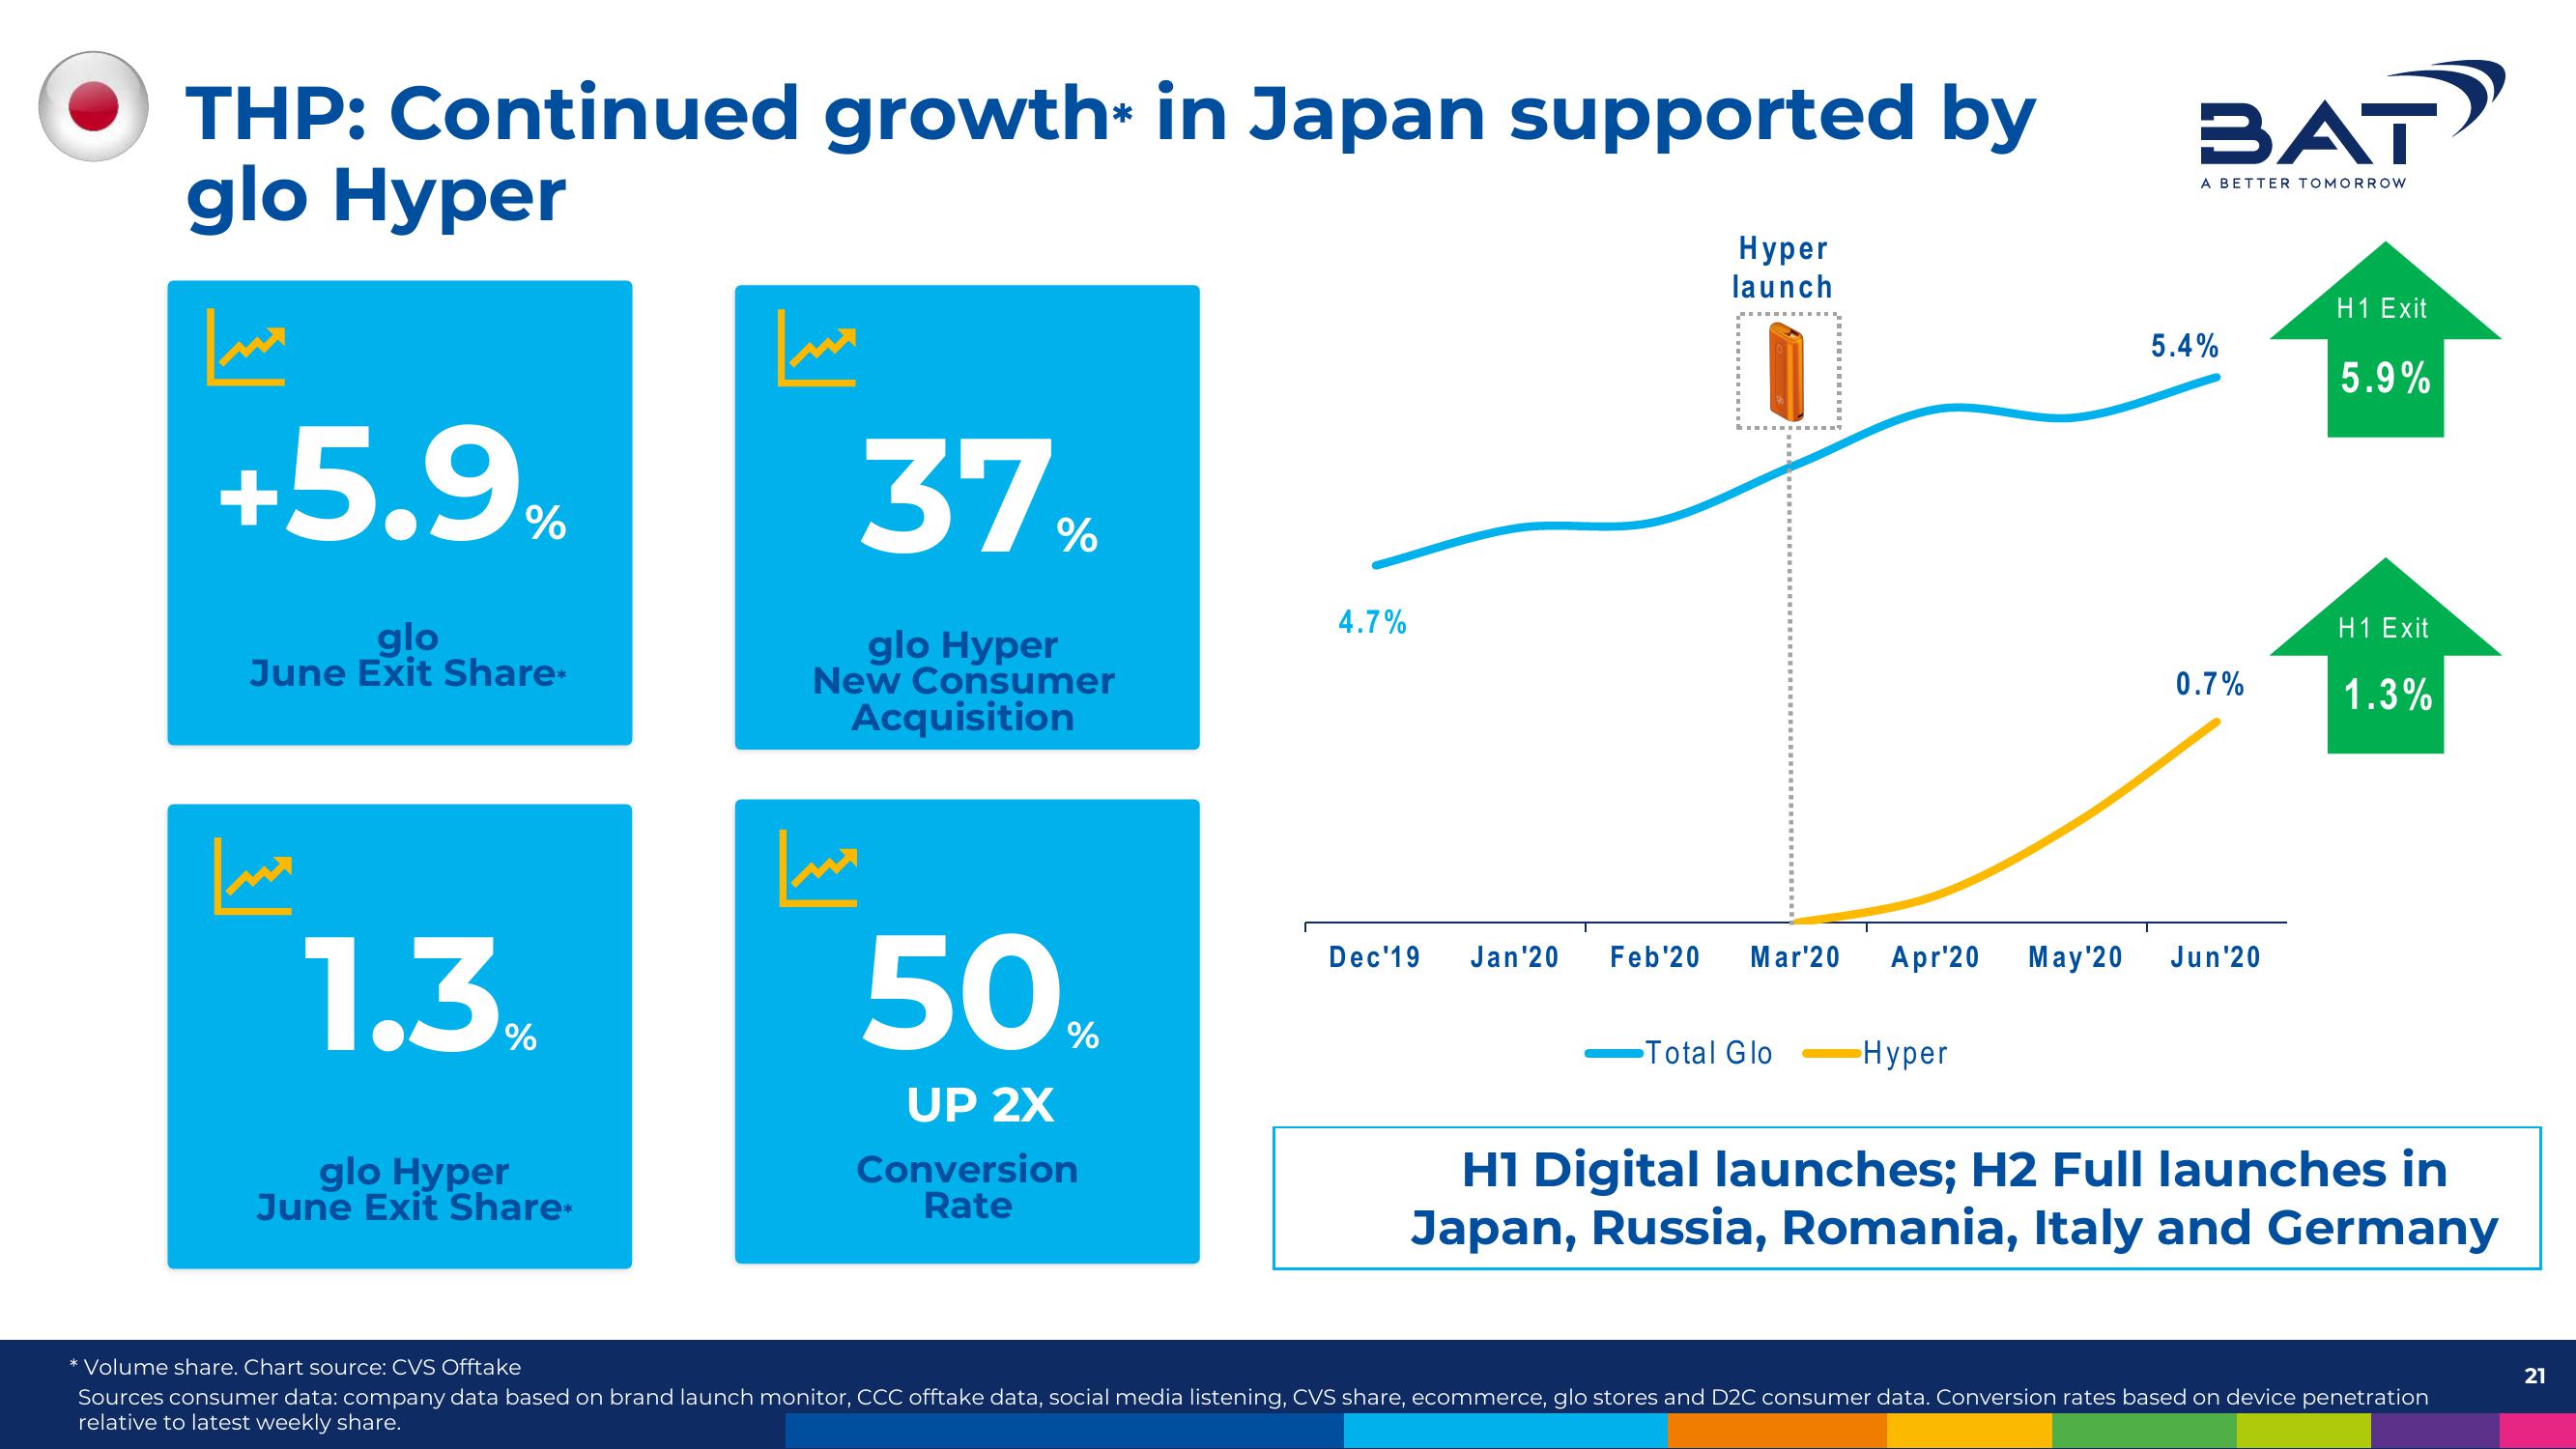
THP: Continued growth in Japan supported by glo Hyper +5.9% glo June Exit Share* 1.3% glo Hyper June Exit Share* میرا 37% glo Hyper New Consumer Acquisition میرا 50% UP 2X Conversion Rate 4.7% Hyper launch Dec'19 Jan'20 Feb'20 Mar'20 Apr¹20 May'20 -Total Glo -Hyper BAT A BETTER TOMORROW 5.4% 0.7% Jun'20 H1 Exit 5.9% H1 Exit 1.3% H1 Digital launches; H2 Full launches in Japan, Russia, Romania, Italy and Germany * Volume share. Chart source: CVS Offtake Sources consumer data: company data based on brand launch monitor, CCC offtake data, social media listening, CVS share, ecommerce, glo stores and D2C consumer data. Conversion rates based on device penetration relative to latest weekly share. 21
View entire presentation