Synchrony Financial Results Presentation Deck
Net Interest Income
Net Interest Income
$ in millions
% of average interest-earning assets
$3,890
Avg.
('16-'20)
15.15%
1Q'20
Payment Rate Trends
17.8%
15.6%
Jan '21
synchrony
15.8%
15.2%
Feb '21
(12)%
$3,439
13.98%
1Q'21
19.4%
15.9%
Mar ¹21
O
●
1Q'21 Highlights
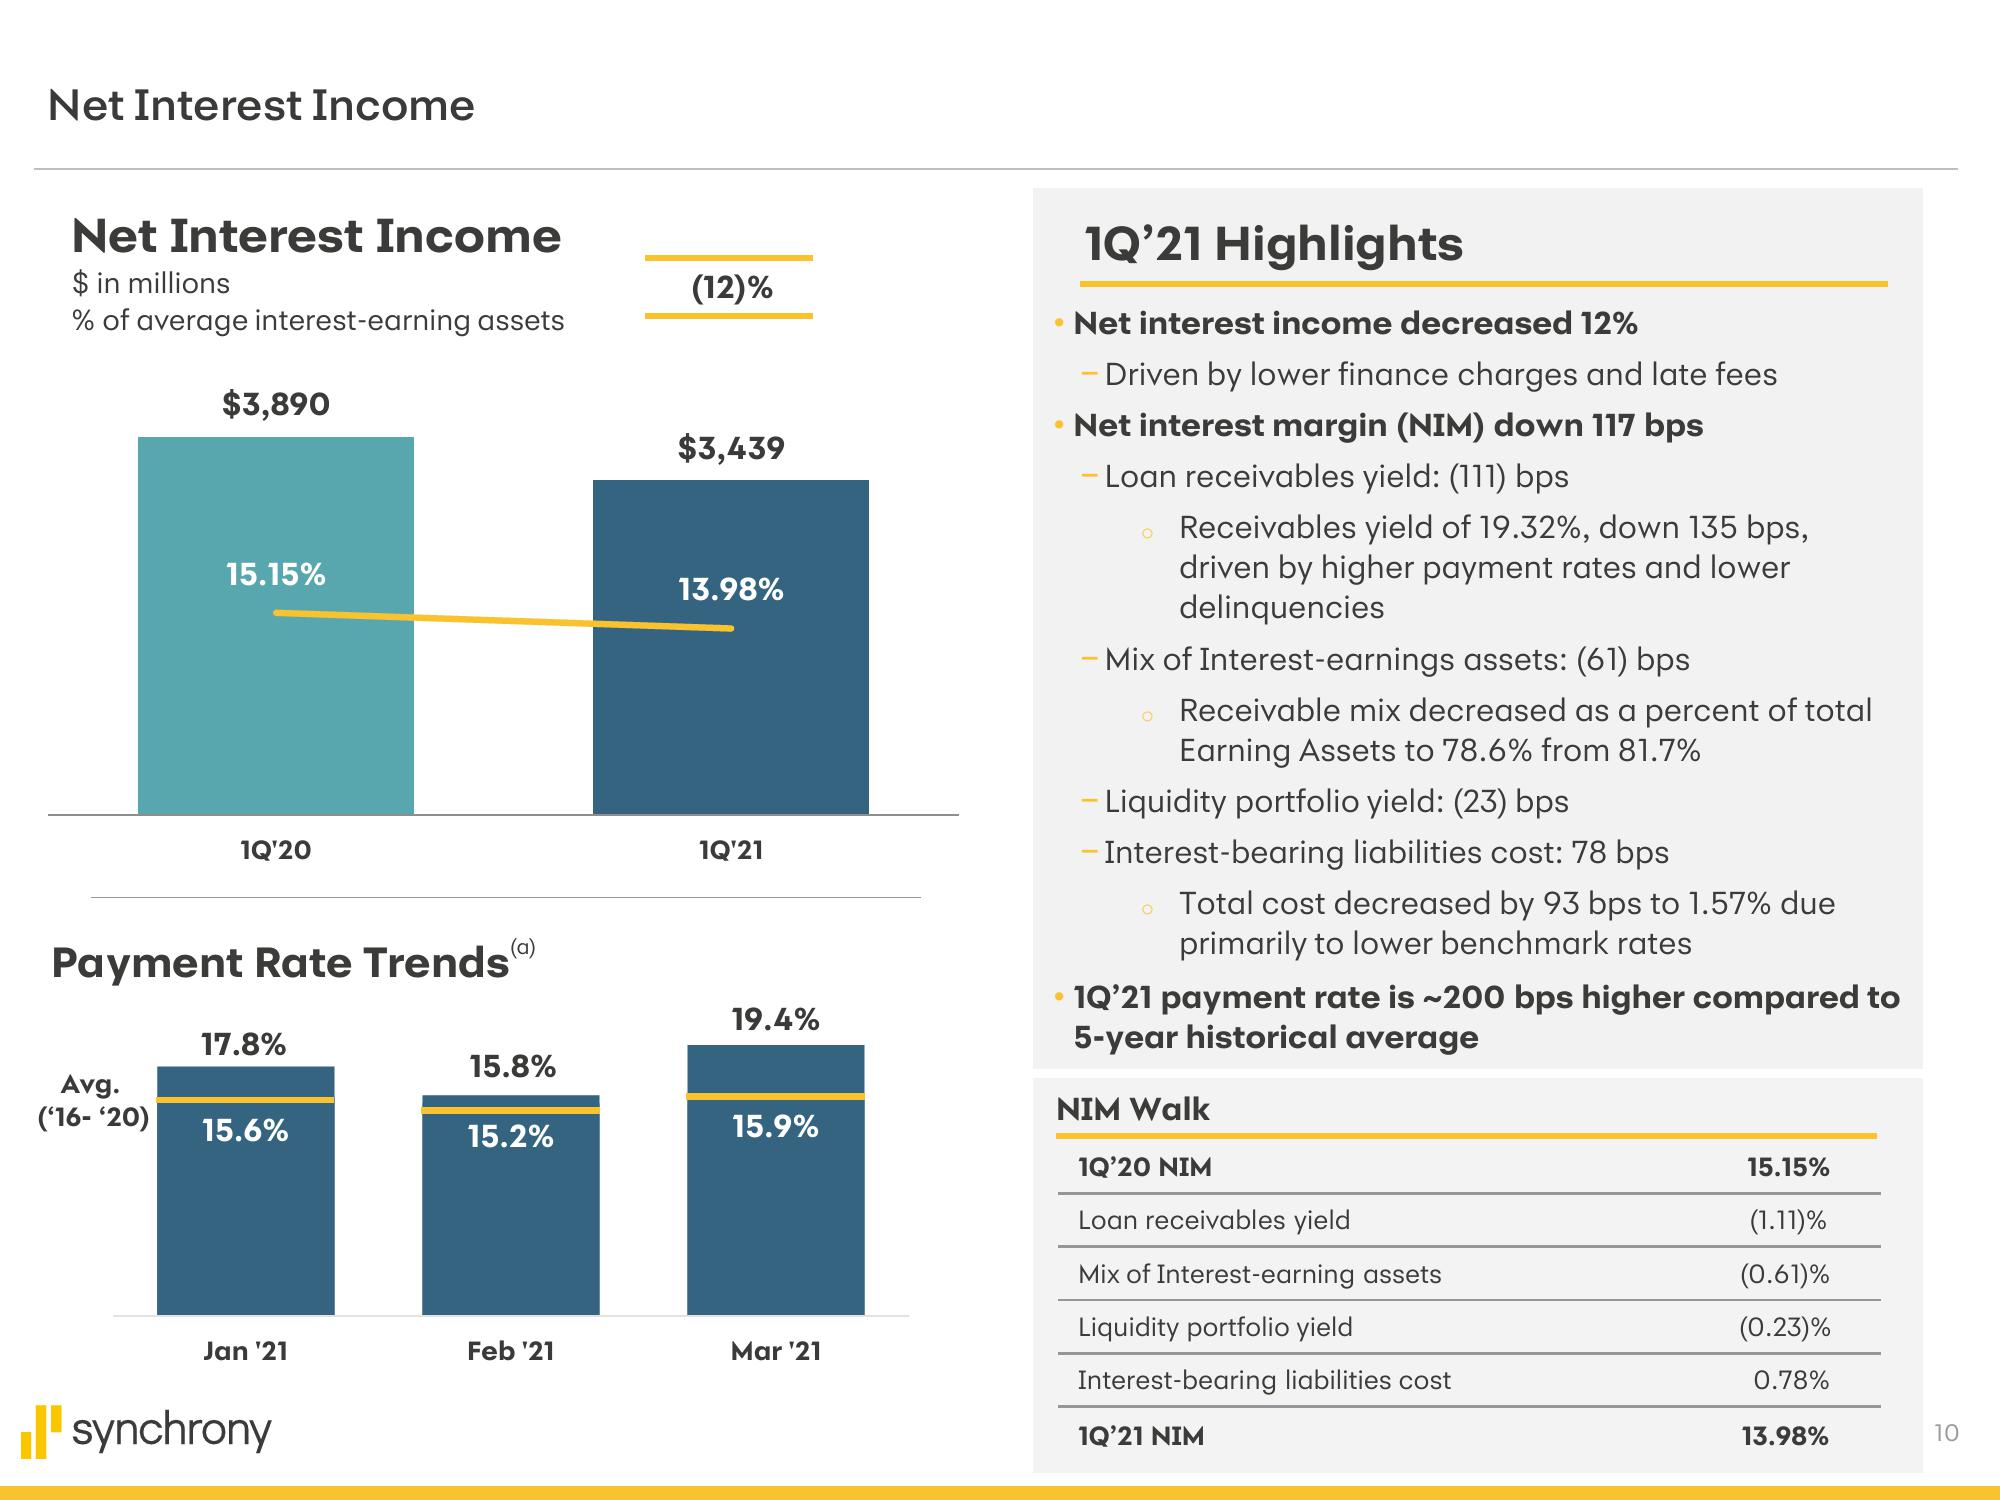
Net interest income decreased 12%
- Driven by lower finance charges and late fees
Net interest margin (NIM) down 117 bps
Loan receivables yield: (111) bps
o Receivables yield of 19.32%, down 135 bps,
driven by higher payment rates and lower
delinquencies
Mix of Interest-earnings assets: (61) bps
Receivable mix decreased as a percent of total
Earning Assets to 78.6% from 81.7%
- Liquidity portfolio yield: (23) bps
- Interest-bearing liabilities cost: 78 bps
。 Total cost decreased by 93 bps to 1.57% due
primarily to lower benchmark rates
●
• 1Q'21 payment rate is ~200 bps higher compared to
5-year historical average
NIM Walk
1Q'20 NIM
Loan receivables yield
Mix of Interest-earning assets
Liquidity portfolio yield
Interest-bearing liabilities cost
1Q'21 NIM
15.15%
(1.11)%
(0.61)%
(0.23)%
0.78%
13.98%
10View entire presentation