DigitalOcean Results Presentation Deck
ņ Adjusted Free Cash Flow and Adjusted Free Cash Flow Margin
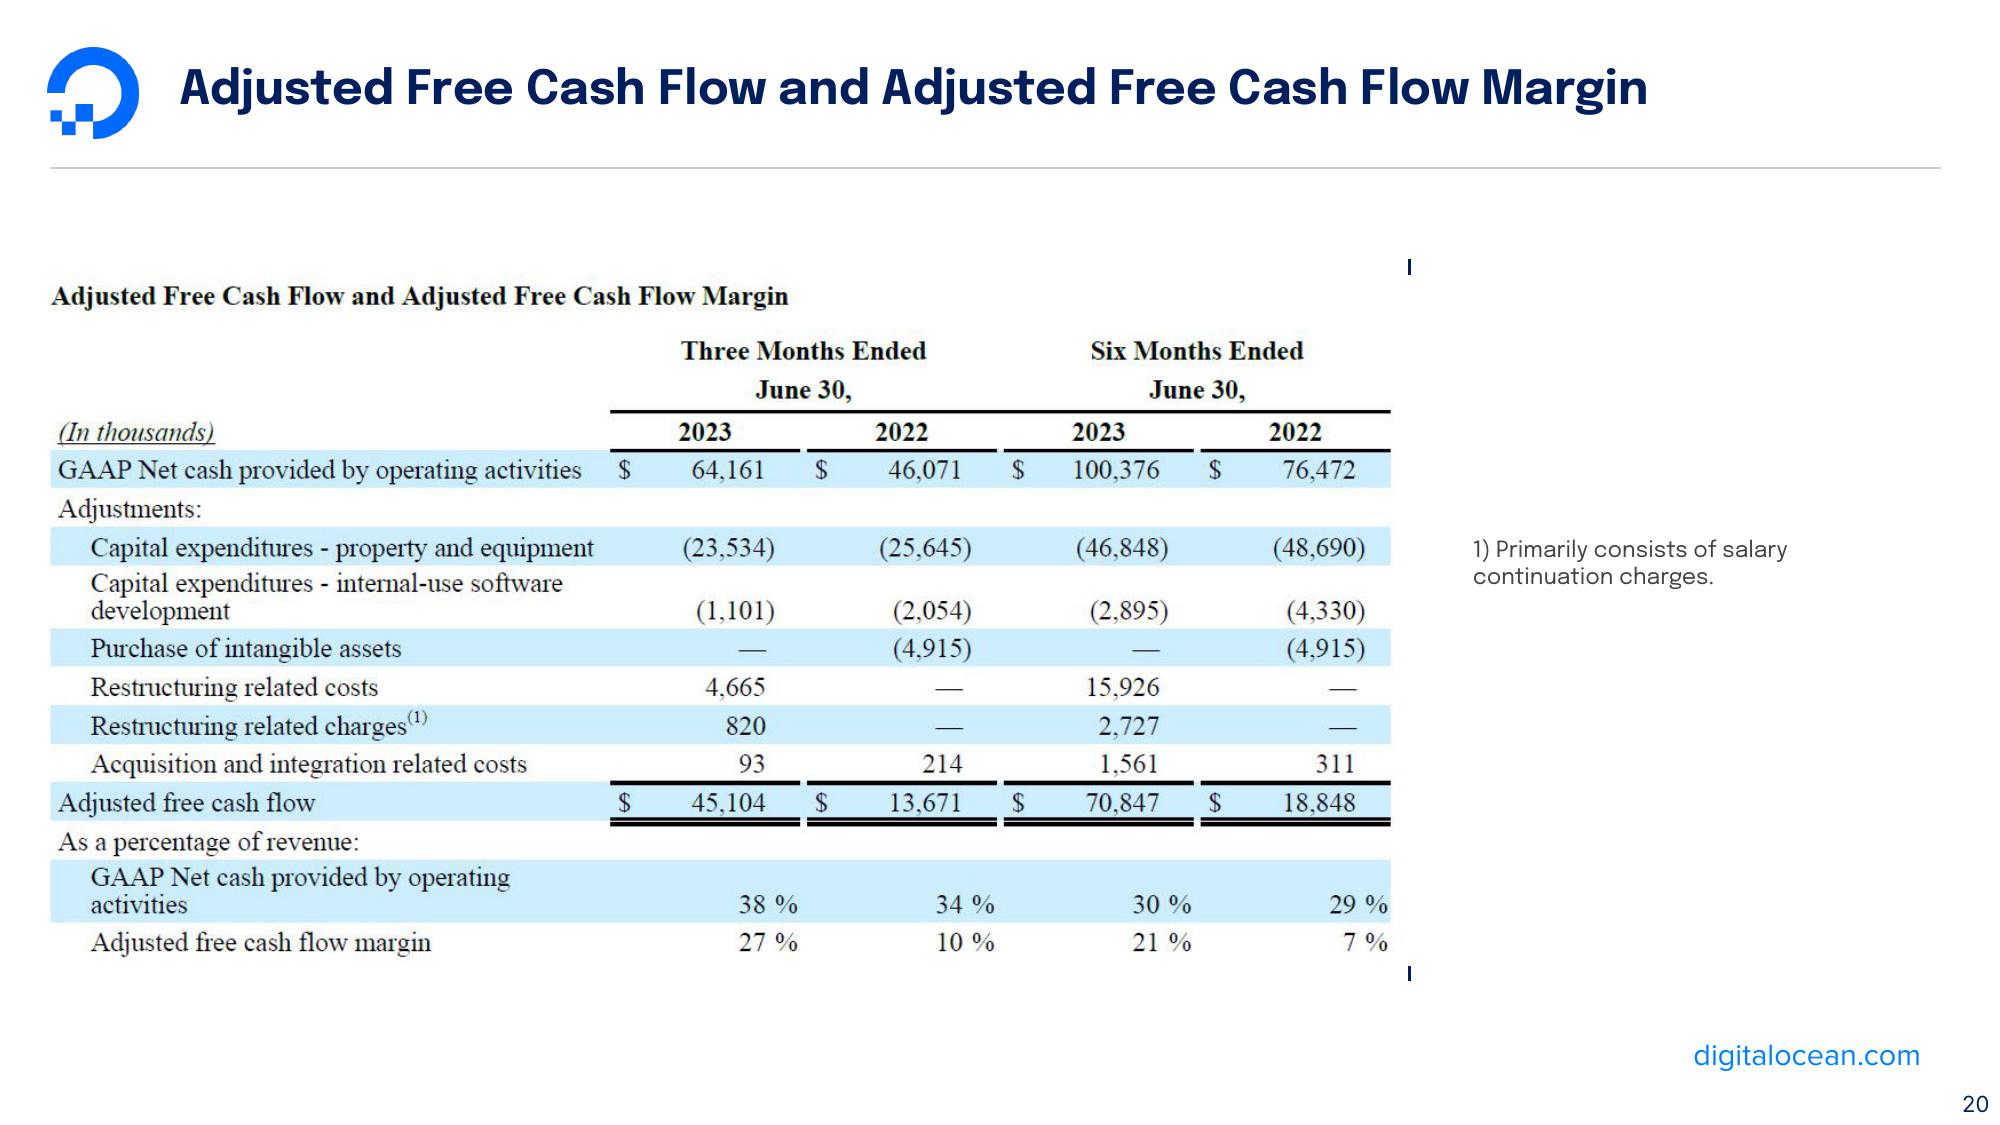
Adjusted Free Cash Flow and Adjusted Free Cash Flow Margin
(In thousands)
GAAP Net cash provided by operating activities
Adjustments:
Capital expenditures - property and equipment
Capital expenditures - internal-use software
development
Purchase of intangible assets
Restructuring related costs
Restructuring related charges (¹)
Acquisition and integration related costs
Adjusted free cash flow
As a percentage of revenue:
GAAP Net cash provided by operating
activities
Adjusted free cash flow margin
$
Three Months Ended
June 30,
2023
64,161 $
(23,534)
(1,101)
4,665
820
93
45,104
38 %
27%
$
2022
46,071
(25,645)
(2,054)
(4,915)
214
13.671
34%
10 %
$
$
Six Months Ended
June 30,
2023
100,376
(46,848)
(2,895)
15,926
2.727
1,561
70,847
30 %
21 %
$
2022
76,472
(48,690)
(4,330)
(4,915)
311
18,848
29%
7%
I
1) Primarily consists of salary
continuation charges.
digitalocean.com
20View entire presentation