Better SPAC Presentation Deck
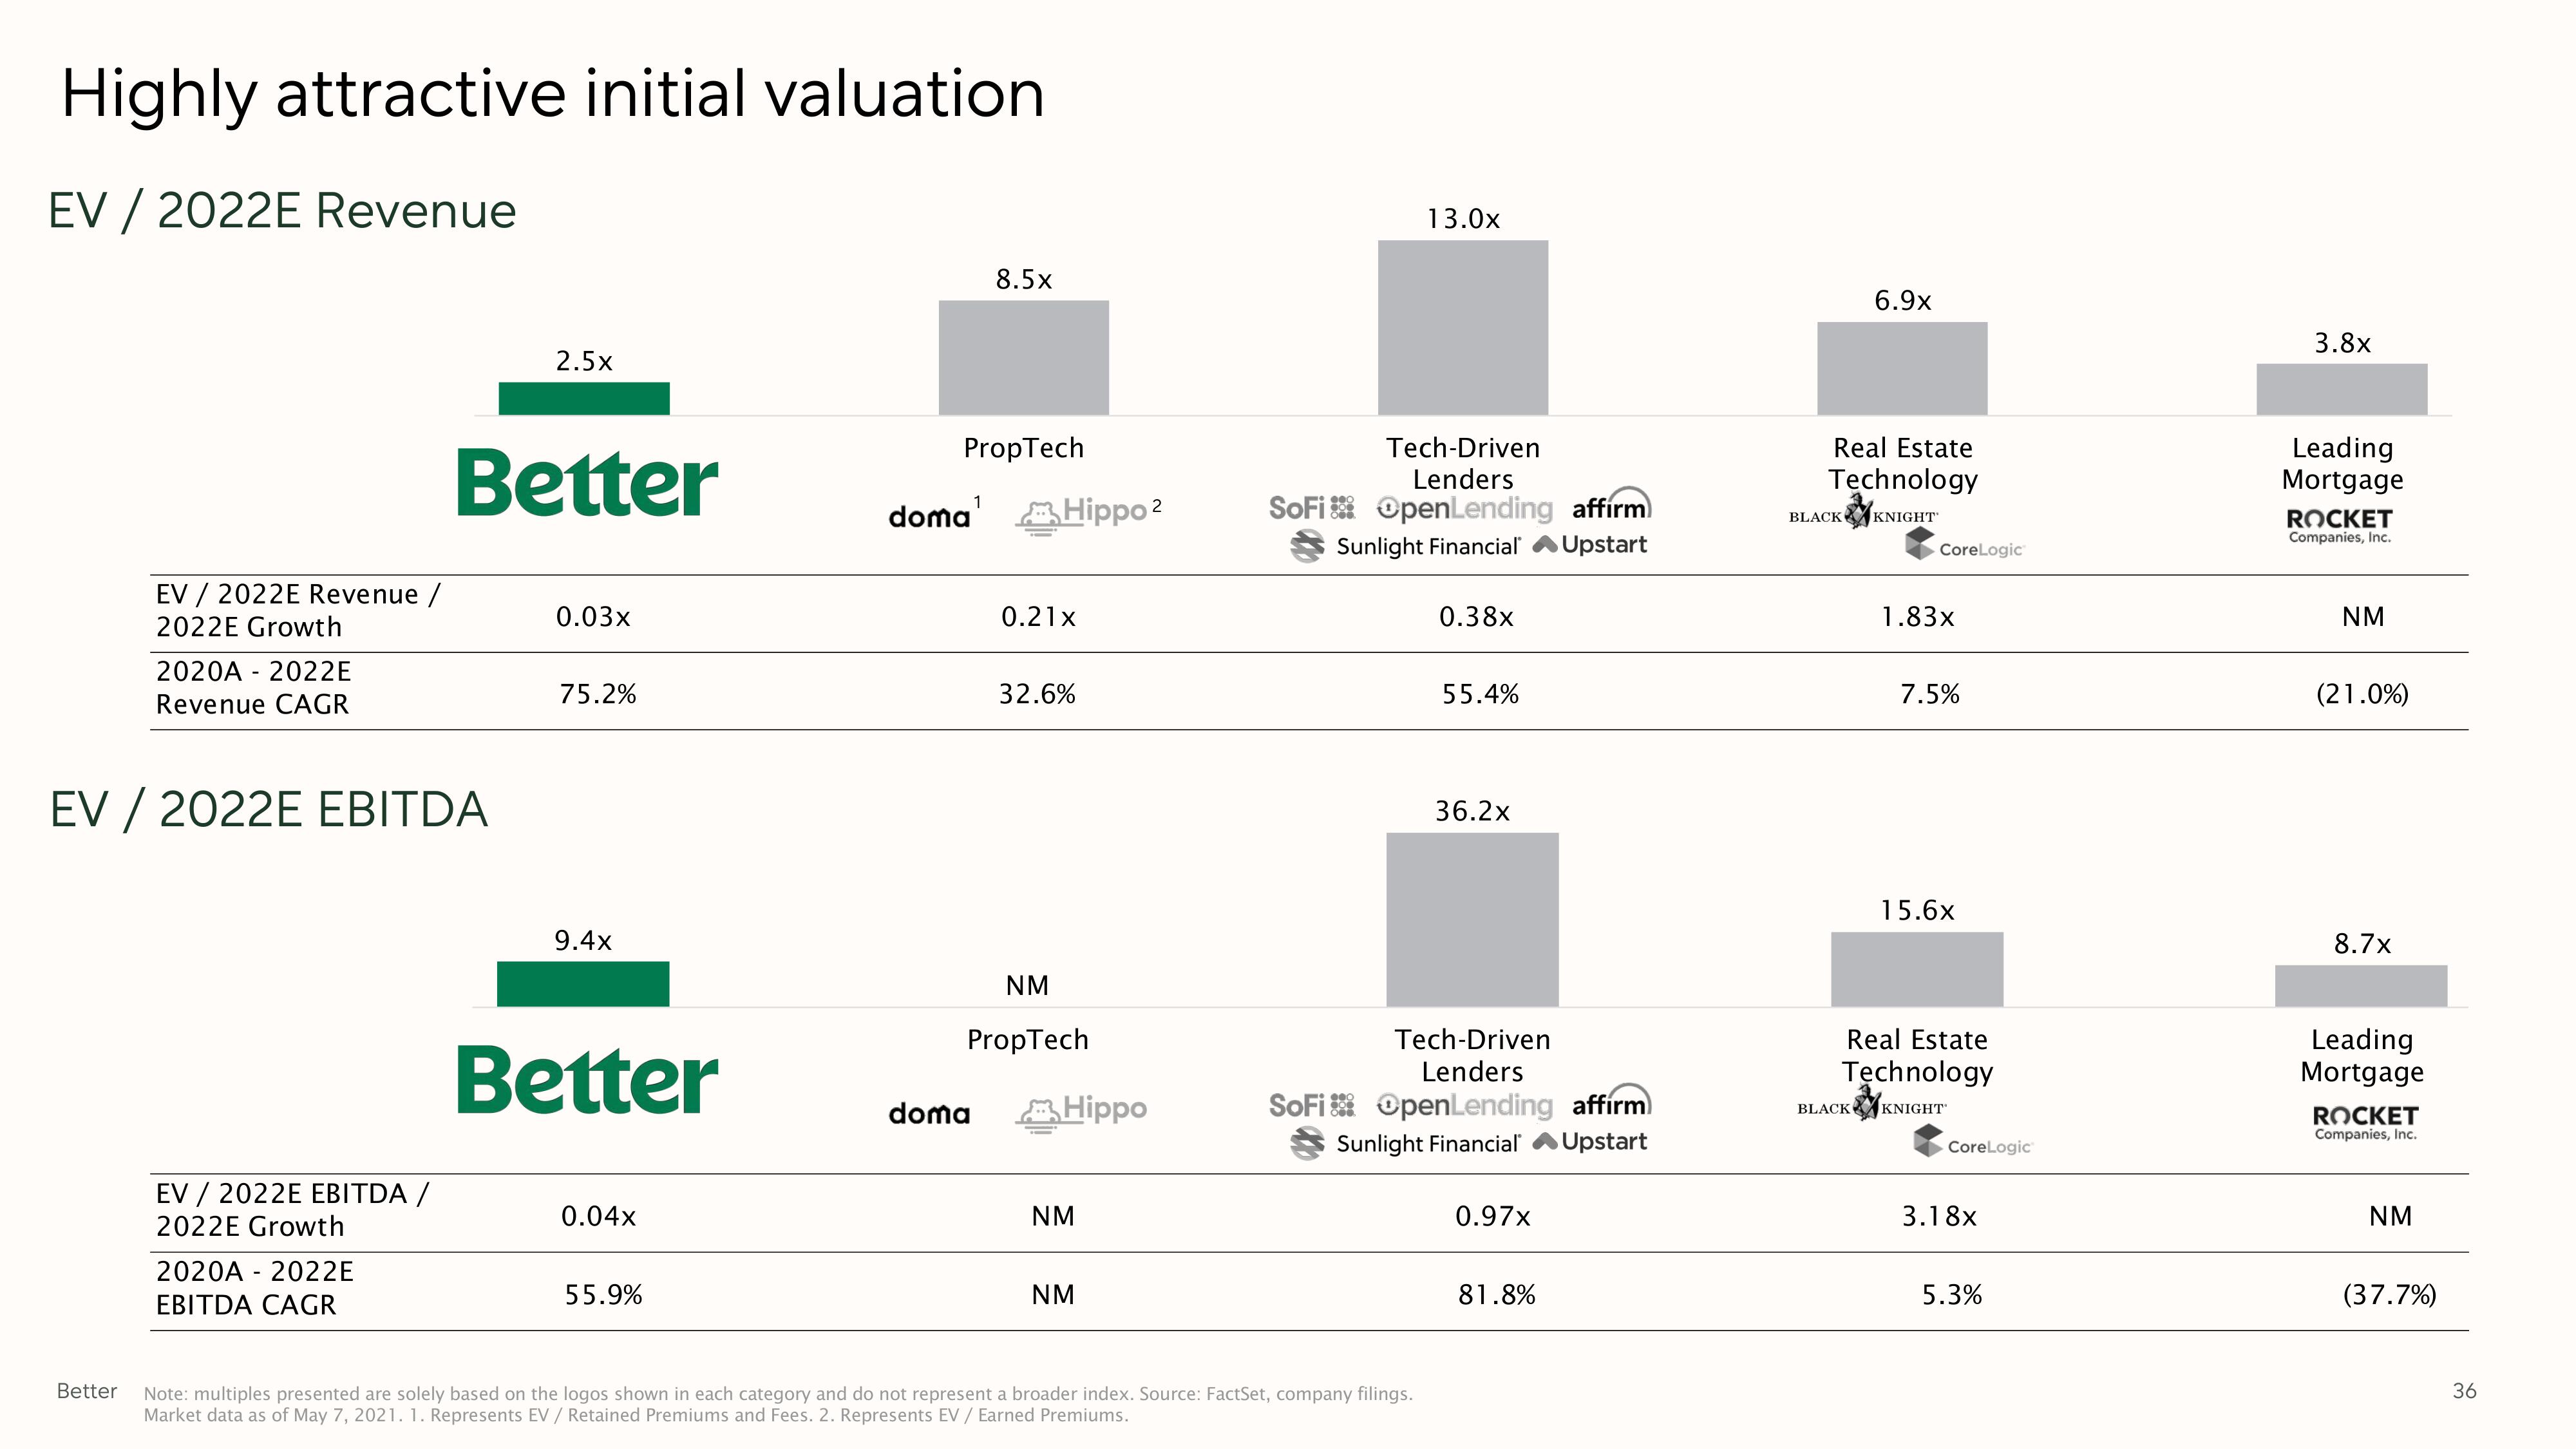
Highly attractive initial valuation
EV / 2022E Revenue
EV / 2022E Revenue /
2022E Growth
Better
2020A 2022E
Revenue CAGR
EV / 2022E EBITDA
EV / 2022E EBITDA /
2022E Growth
2020A 2022E
EBITDA CAGR
2.5x
Better
0.03x
75.2%
9.4x
Better
0.04x
55.9%
8.5x
PropTech
doma¹ Hippo ²
doma
0.21x
32.6%
NM
PropTech
Hippo
NM
NM
13.0x
Tech-Driven
Lenders
SoFi OpenLending affirm
Sunlight Financial Upstart
0.38x
Note: multiples presented are solely based on the logos shown in each category and do not represent a broader index. Source: FactSet, company filings.
Market data as of May 7, 2021. 1. Represents EV / Retained Premiums and Fees. 2. Represents EV / Earned Premiums.
55.4%
36.2x
Tech-Driven
Lenders
SoFi OpenLending affirm
Sunlight Financial Upstart
0.97x
81.8%
6.9x
Real Estate
Technology
BLACK KNIGHT
CoreLogic
1.83x
7.5%
15.6x
Real Estate
Technology
BLACK KNIGHT
CoreLogic
3.18x
5.3%
3.8x
Leading
Mortgage
ROCKET
Companies, Inc.
NM
(21.0%)
8.7x
Leading
Mortgage
ROCKET
Companies, Inc.
NM
(37.7%)
36View entire presentation