FlexJet SPAC Presentation Deck
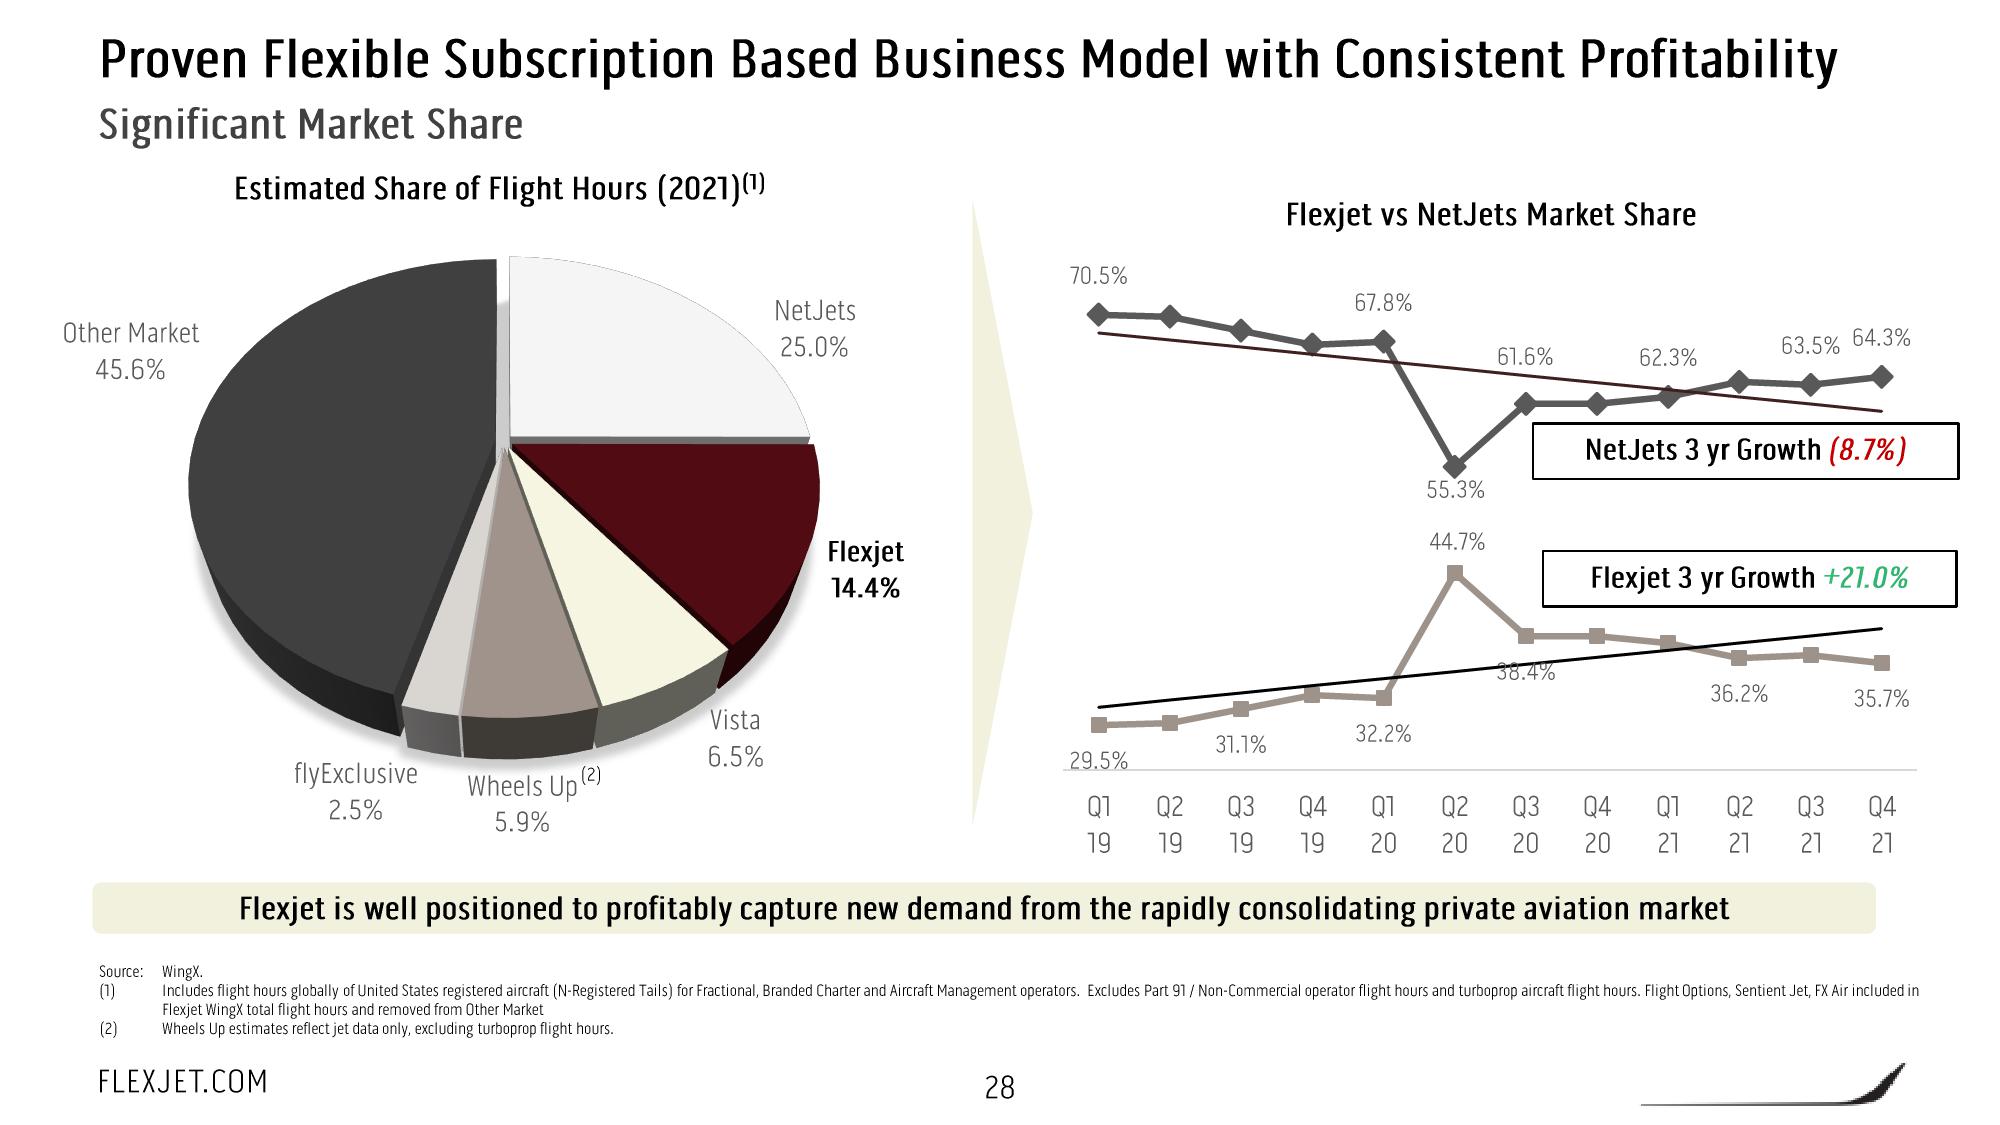
Proven Flexible Subscription Based Business Model with Consistent Profitability
Significant Market Share
Estimated Share of Flight Hours (2021)(¹)
Other Market
45.6%
Source:
(1)
(2)
fly Exclusive
2.5%
Wheels Up (2)
5.9%
FLEXJET.COM
Vista
6.5%
NetJets
25.0%
Flexjet
14.4%
70.5%
29.5%
Q1
19
28
31.1%
Flexjet vs NetJets Market Share
67.8%
32.2%
55.3%
44.7%
61.6%
38.4%
62.3%
NetJets 3 yr Growth (8.7%)
63.5% 64.3%
Flexjet 3 yr Growth +21.0%
36.2%
Q2 Q3 Q4 Q1 Q2 Q3 Q4 Q1
19 19 19 20 20 20 20 21
Flexjet is well positioned to profitably capture new demand from the rapidly consolidating private aviation market
35.7%
Q4
Q2 Q3
21 21 21
Wingx.
Includes flight hours globally of United States registered aircraft (N-Registered Tails) for Fractional, Branded Charter and Aircraft Management operators. Excludes Part 91/ Non-Commercial operator flight hours and turboprop aircraft flight hours. Flight Options, Sentient Jet, FX Air included in
Flexjet Wingx total flight hours and removed from Other Market
Wheels Up estimates reflect jet data only, excluding turboprop flight hours.View entire presentation