Netstreit Investor Presentation Deck
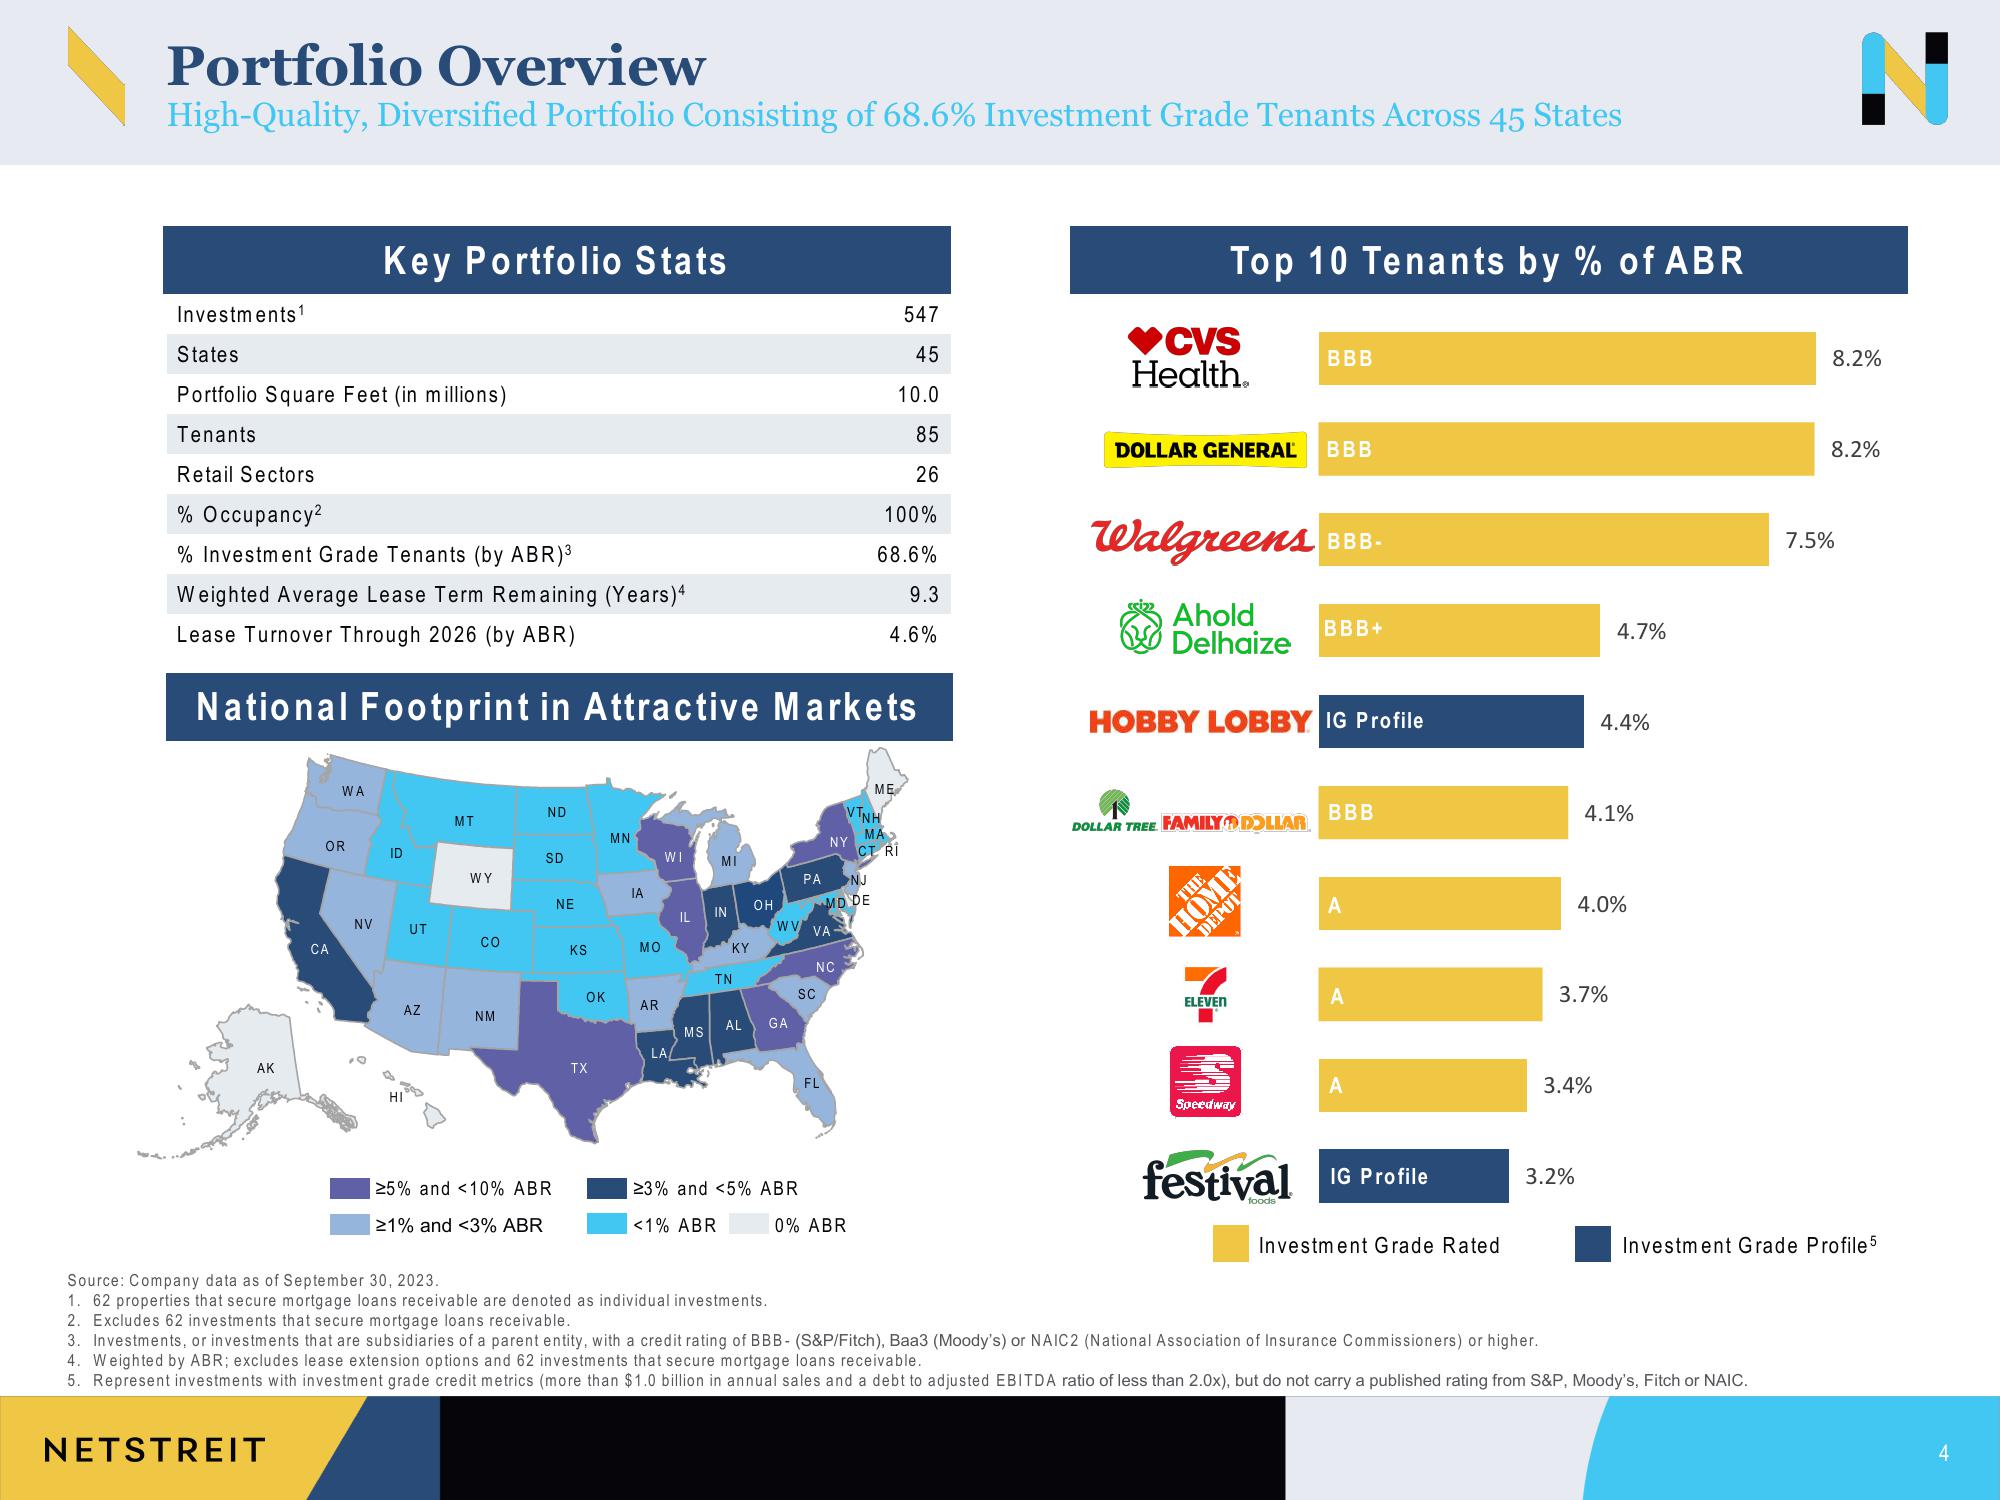
Portfolio Overview
High-Quality, Diversified Portfolio Consisting of 68.6% Investment Grade Tenants Across 45 States
Investments 1
AK
States
Portfolio Square Feet (in millions)
Tenants.
Retail Sectors
% Occupancy²
% Investment Grade Tenants (by ABR)³
Weighted Average Lease Term Remaining (Years)4
Lease Turnover Through 2026 (by ABR)
National Footprint in Attractive Markets
NETSTREIT
WA
OR
CA
Key Portfolio Stats
NV
ID
UT
AZ
HI
MT
WY
CO
NM
ND
SD
≥5% and <10% ABR
≥1% and <3% ABR
NE
KS
OK
TX
MN
IA
MO
AR
WI
LA/
IL
MS
IN
KY
TN
AL
OH
GA
PA
WV VA
23% and <5% ABR
<1% ABR
SC
NY
NC
FL
NJ
MD DE
VTNH
0% ABR
547
45
10.0
85
26
100%
68.6%
ME
9.3
4.6%
MA
CT RI
♥CVS
Health
Top 10 Tenants by % of ABR
DOLLAR GENERAL BBB
Walgreens BBB-
Ahold
Delhaize
DOLLAR TREE FAMILY DOLLAR
THE
HOBBY LOBBY IG Profile
BBB
HOME
DEPOT
ELEVEN
Speedway
BBB+
III
BBB
A
A
A
festival IG Profile
Investment Grade Rated
3.2%
4.7%
4.4%
4.1%
3.7%
3.4%
4.0%
Source: Company data as of September 30, 2023.
1. 62 properties that secure mortgage loans receivable are denoted as individual investments.
2. Excludes 62 investments that secure mortgage loans receivable.
3. Investments, or investments that are subsidiaries of a parent entity, with a credit rating of BBB- (S&P/Fitch), Baa3 (Moody's) or NAIC2 (National Association of Insurance Commissioners) or higher.
4. Weighted by ABR; excludes lease extension options and 62 investments that secure mortgage loans receivable.
5. Represent investments with investment grade credit metrics (more than $1.0 billion in annual sales and a debt to adjusted EBITDA ratio of less than 2.0x), but do not carry a published rating from S&P, Moody's, Fitch or NAIC.
8.2%
8.2%
7.5%
Investment Grade Profile 5View entire presentation