HireRight Results Presentation Deck
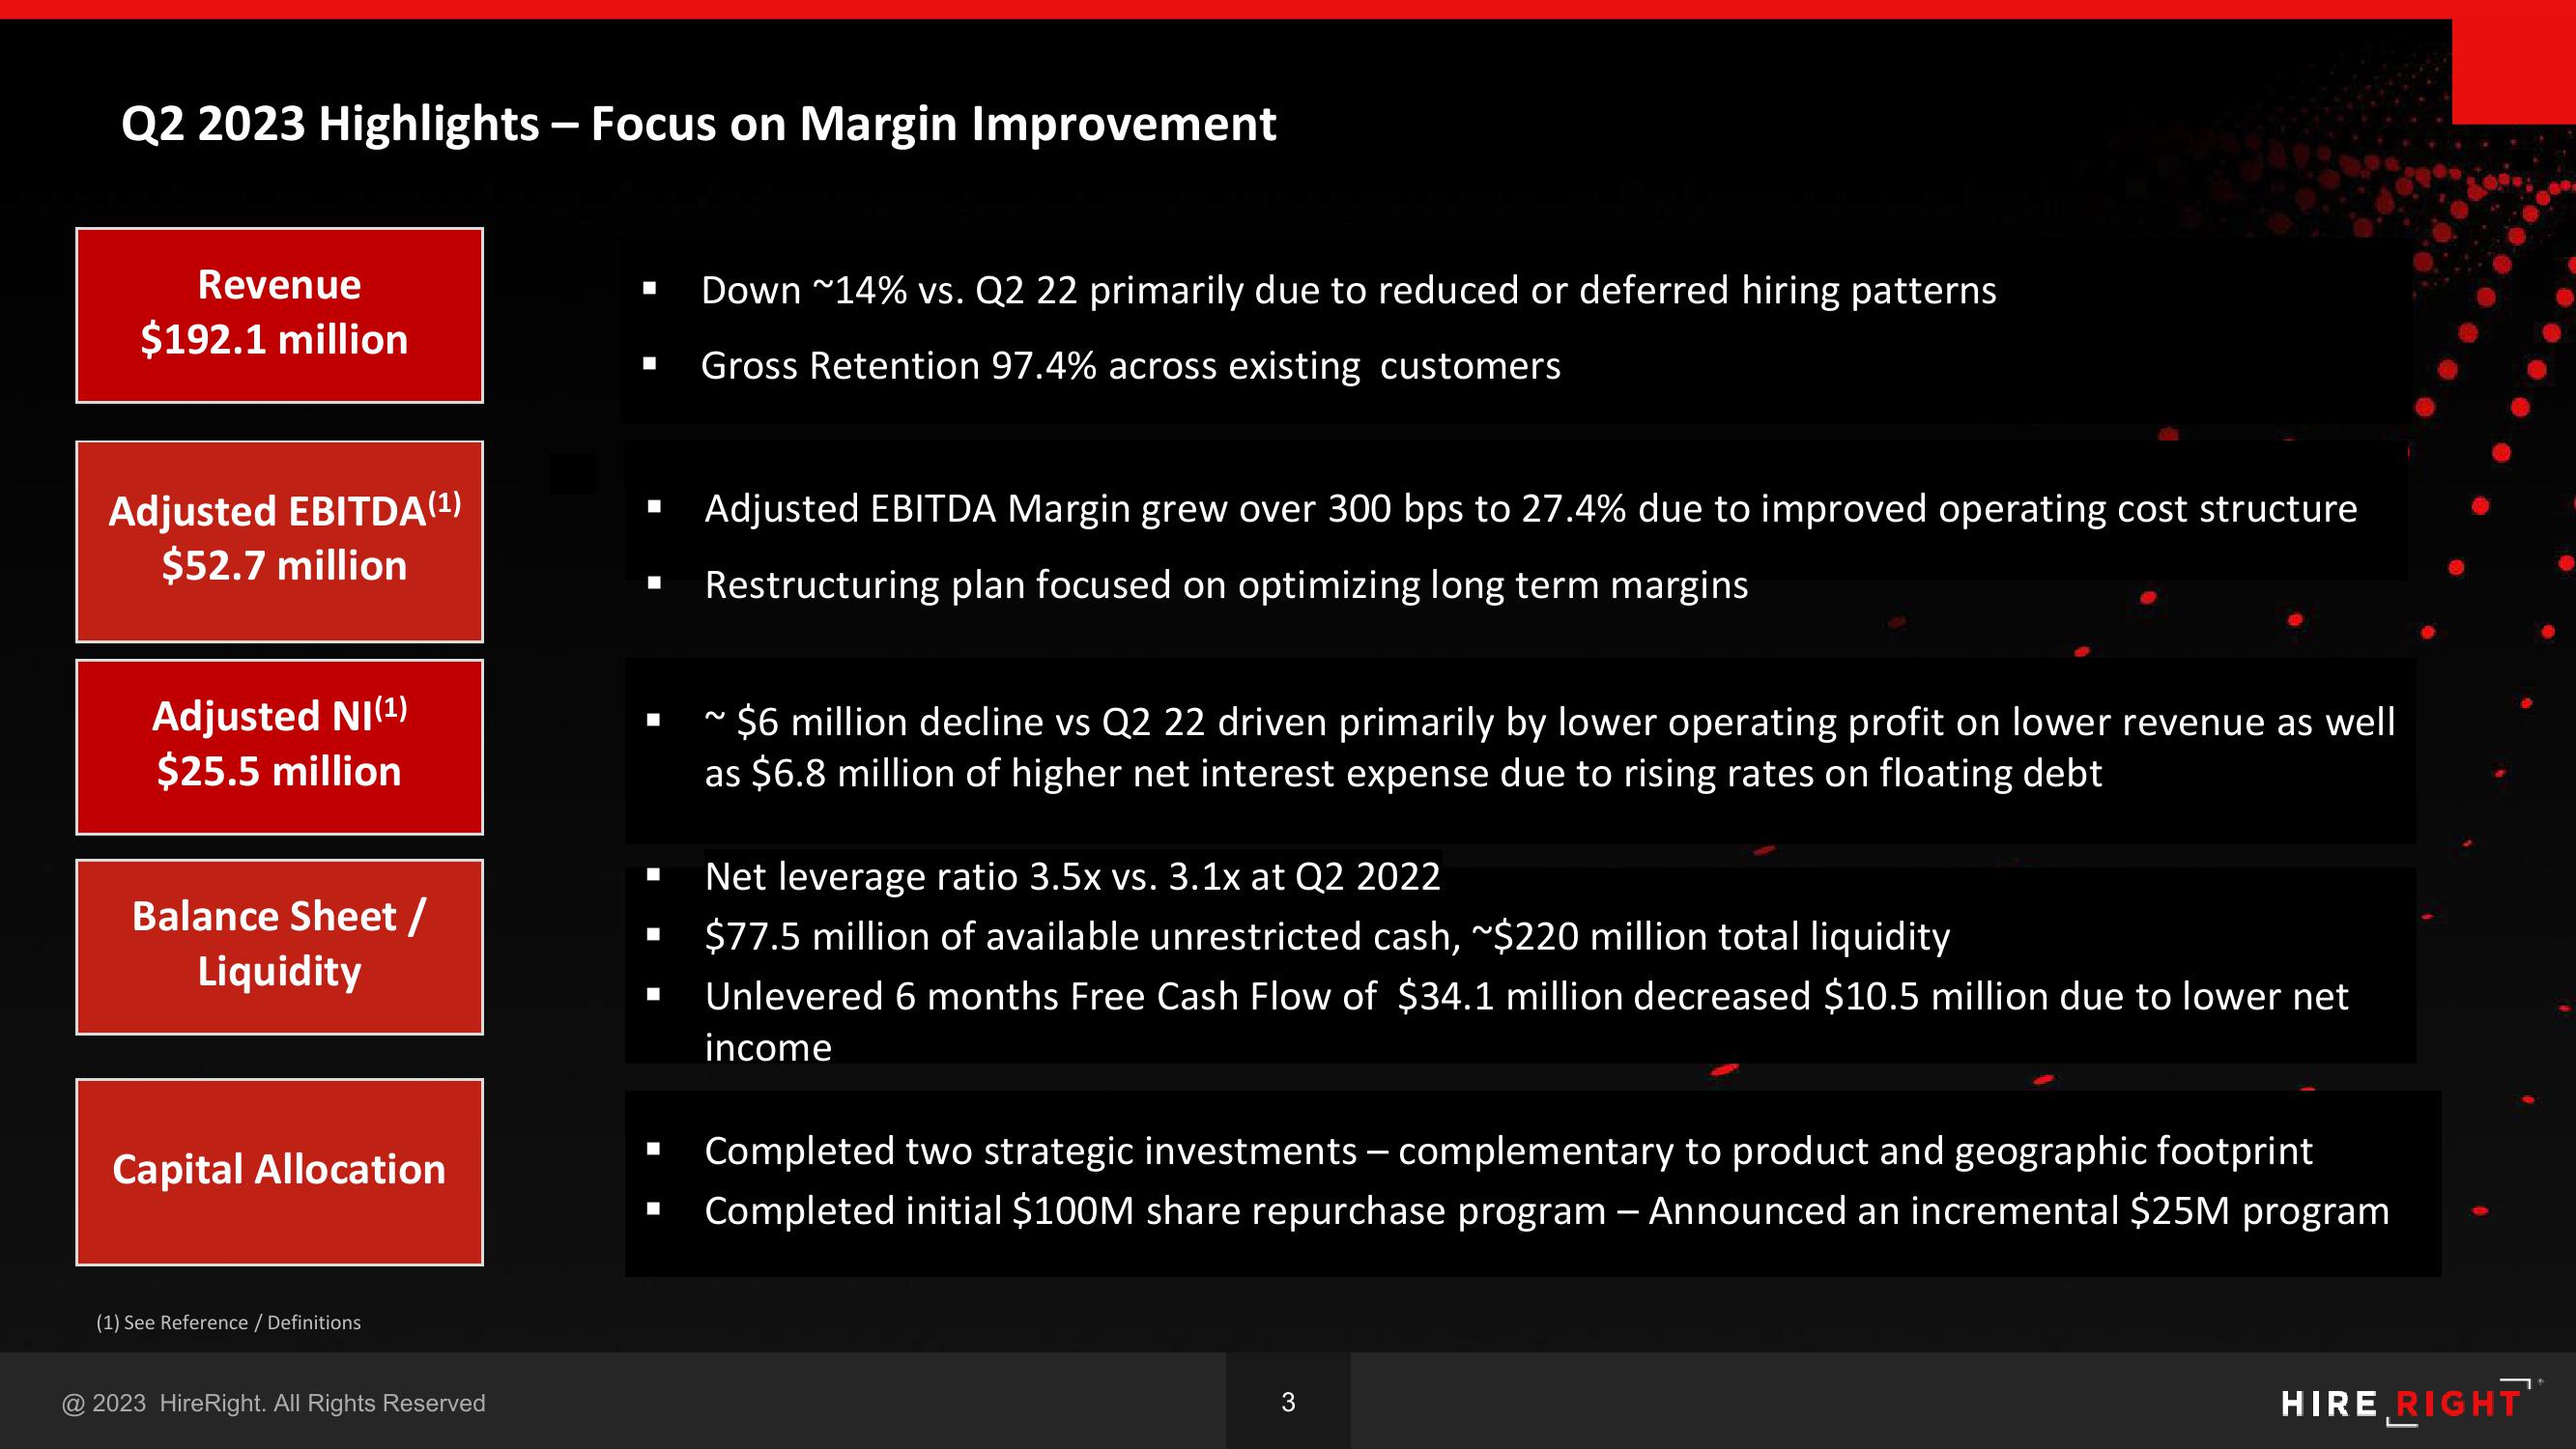
Q2 2023 Highlights - Focus on Margin Improvement
Revenue
$192.1 million
Adjusted EBITDA (¹)
$52.7 million
Adjusted NI(¹)
$25.5 million
Balance Sheet/
Liquidity
Capital Allocation
(1) See Reference / Definitions
@ 2023 HireRight. All Rights Reserved
■
■
■
Down ~14% vs. Q2 22 primarily due to reduced or deferred hiring patterns
Gross Retention 97.4% across existing customers
Adjusted EBITDA Margin grew over 300 bps to 27.4% due to improved operating cost structure
Restructuring plan focused on optimizing long term margins
~$6 million decline vs Q2 22 driven primarily by lower operating profit on lower revenue as well
as $6.8 million of higher net interest expense due to rising rates on floating debt
Net leverage ratio 3.5x vs. 3.1x at Q2 2022
$77.5 million of available unrestricted cash, ~$220 million total liquidity
Unlevered 6 months Free Cash Flow of $34.1 million decreased $10.5 million due to lower net
income
Completed two strategic investments - complementary to product and geographic footprint
Completed initial $100M share repurchase program - Announced an incremental $25M program
3
HIRE RIGHTView entire presentation