Inovalon Results Presentation Deck
Strong Growth Inflection
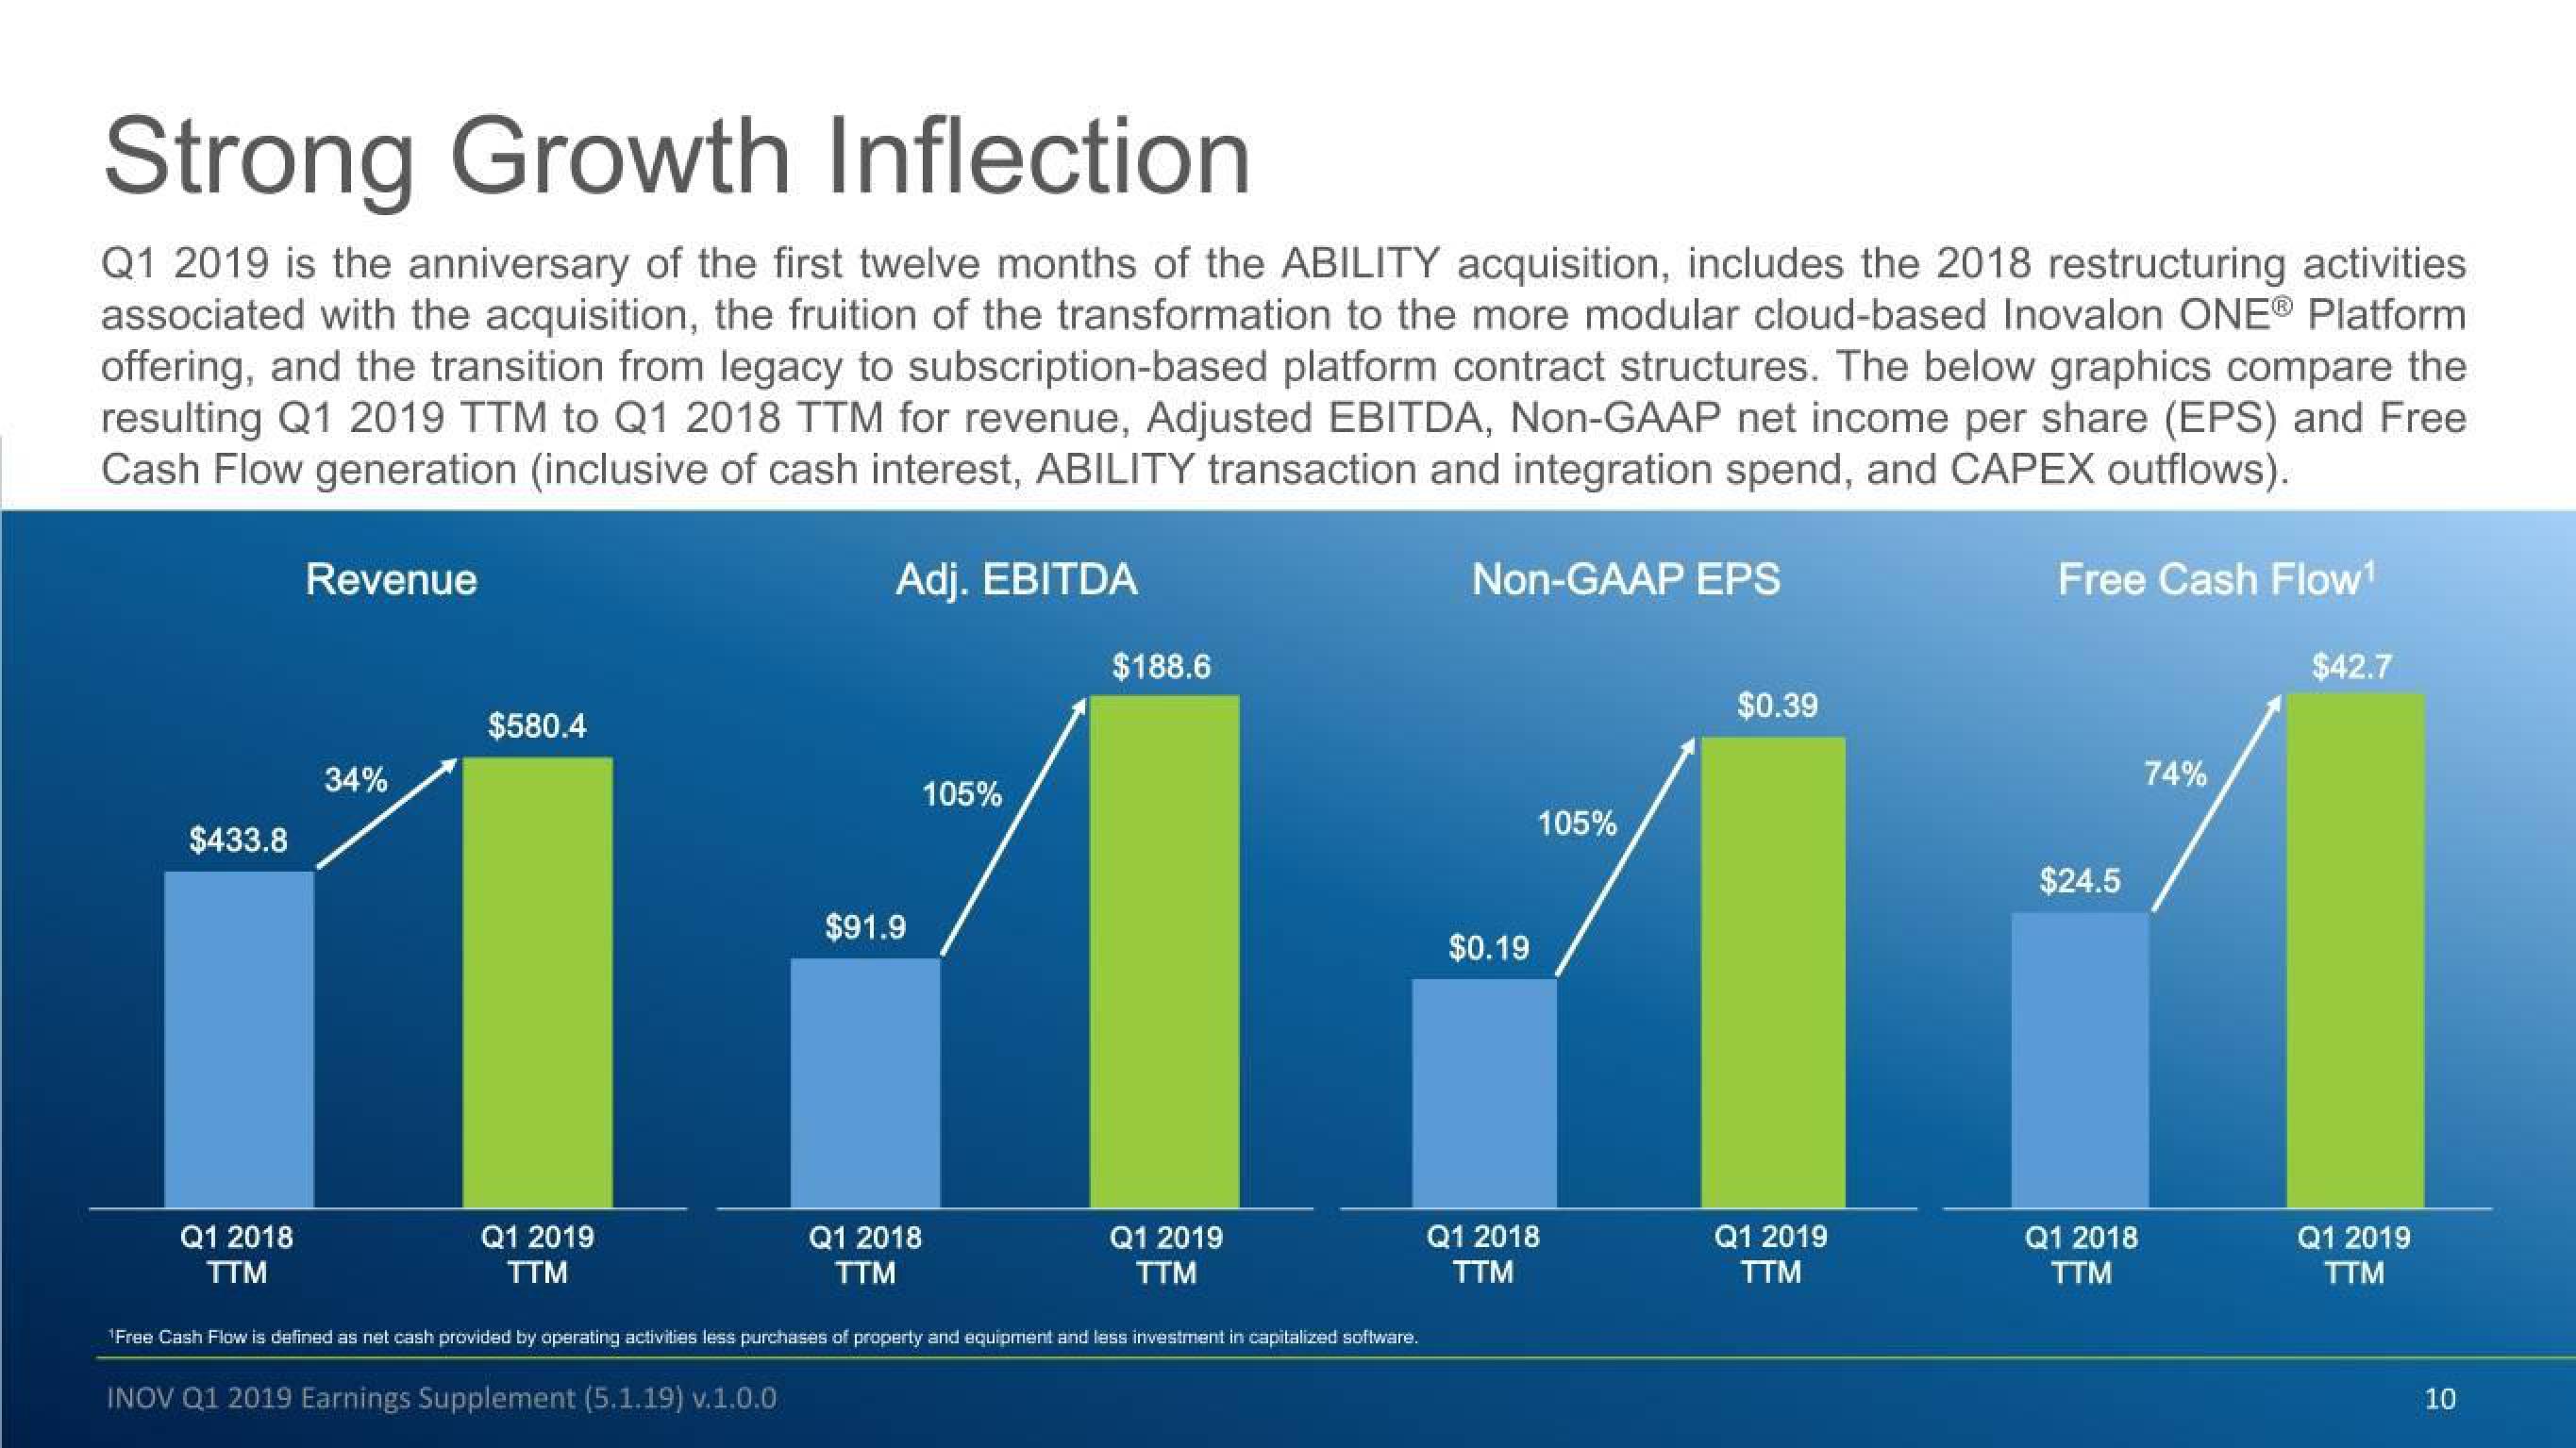
Q1 2019 is the anniversary of the first twelve months of the ABILITY acquisition, includes the 2018 restructuring activities
associated with the acquisition, the fruition of the transformation to the more modular cloud-based Inovalon ONE® Platform
offering, and the transition from legacy to subscription-based platform contract structures. The below graphics compare the
resulting Q1 2019 TTM to Q1 2018 TTM for revenue, Adjusted EBITDA, Non-GAAP net income per share (EPS) and Free
Cash Flow generation (inclusive of cash interest, ABILITY transaction and integration spend, and CAPEX outflows).
Adj. EBITDA
$433.8
Q1 2018
TTM
Revenue
34%
$580.4
Q1 2019
TTM
$91.9
INOV Q1 2019 Earnings Supplement (5.1.19) v.1.0.0
Q1 2018
TTM
105%
$188.6
Q1 2019
TTM
¹Free Cash Flow is defined as net cash provided by operating activities less purchases of property and equipment and less investment in capitalized software.
Non-GAAP EPS
$0.19
105%
Q1 2018
TTM
$0.39
Q1 2019
TTM
Free Cash Flow¹
$24.5
Q1 2018
TTM
74%
$42.7
Q1 2019
TTM
10View entire presentation