Bank of America Results Presentation Deck
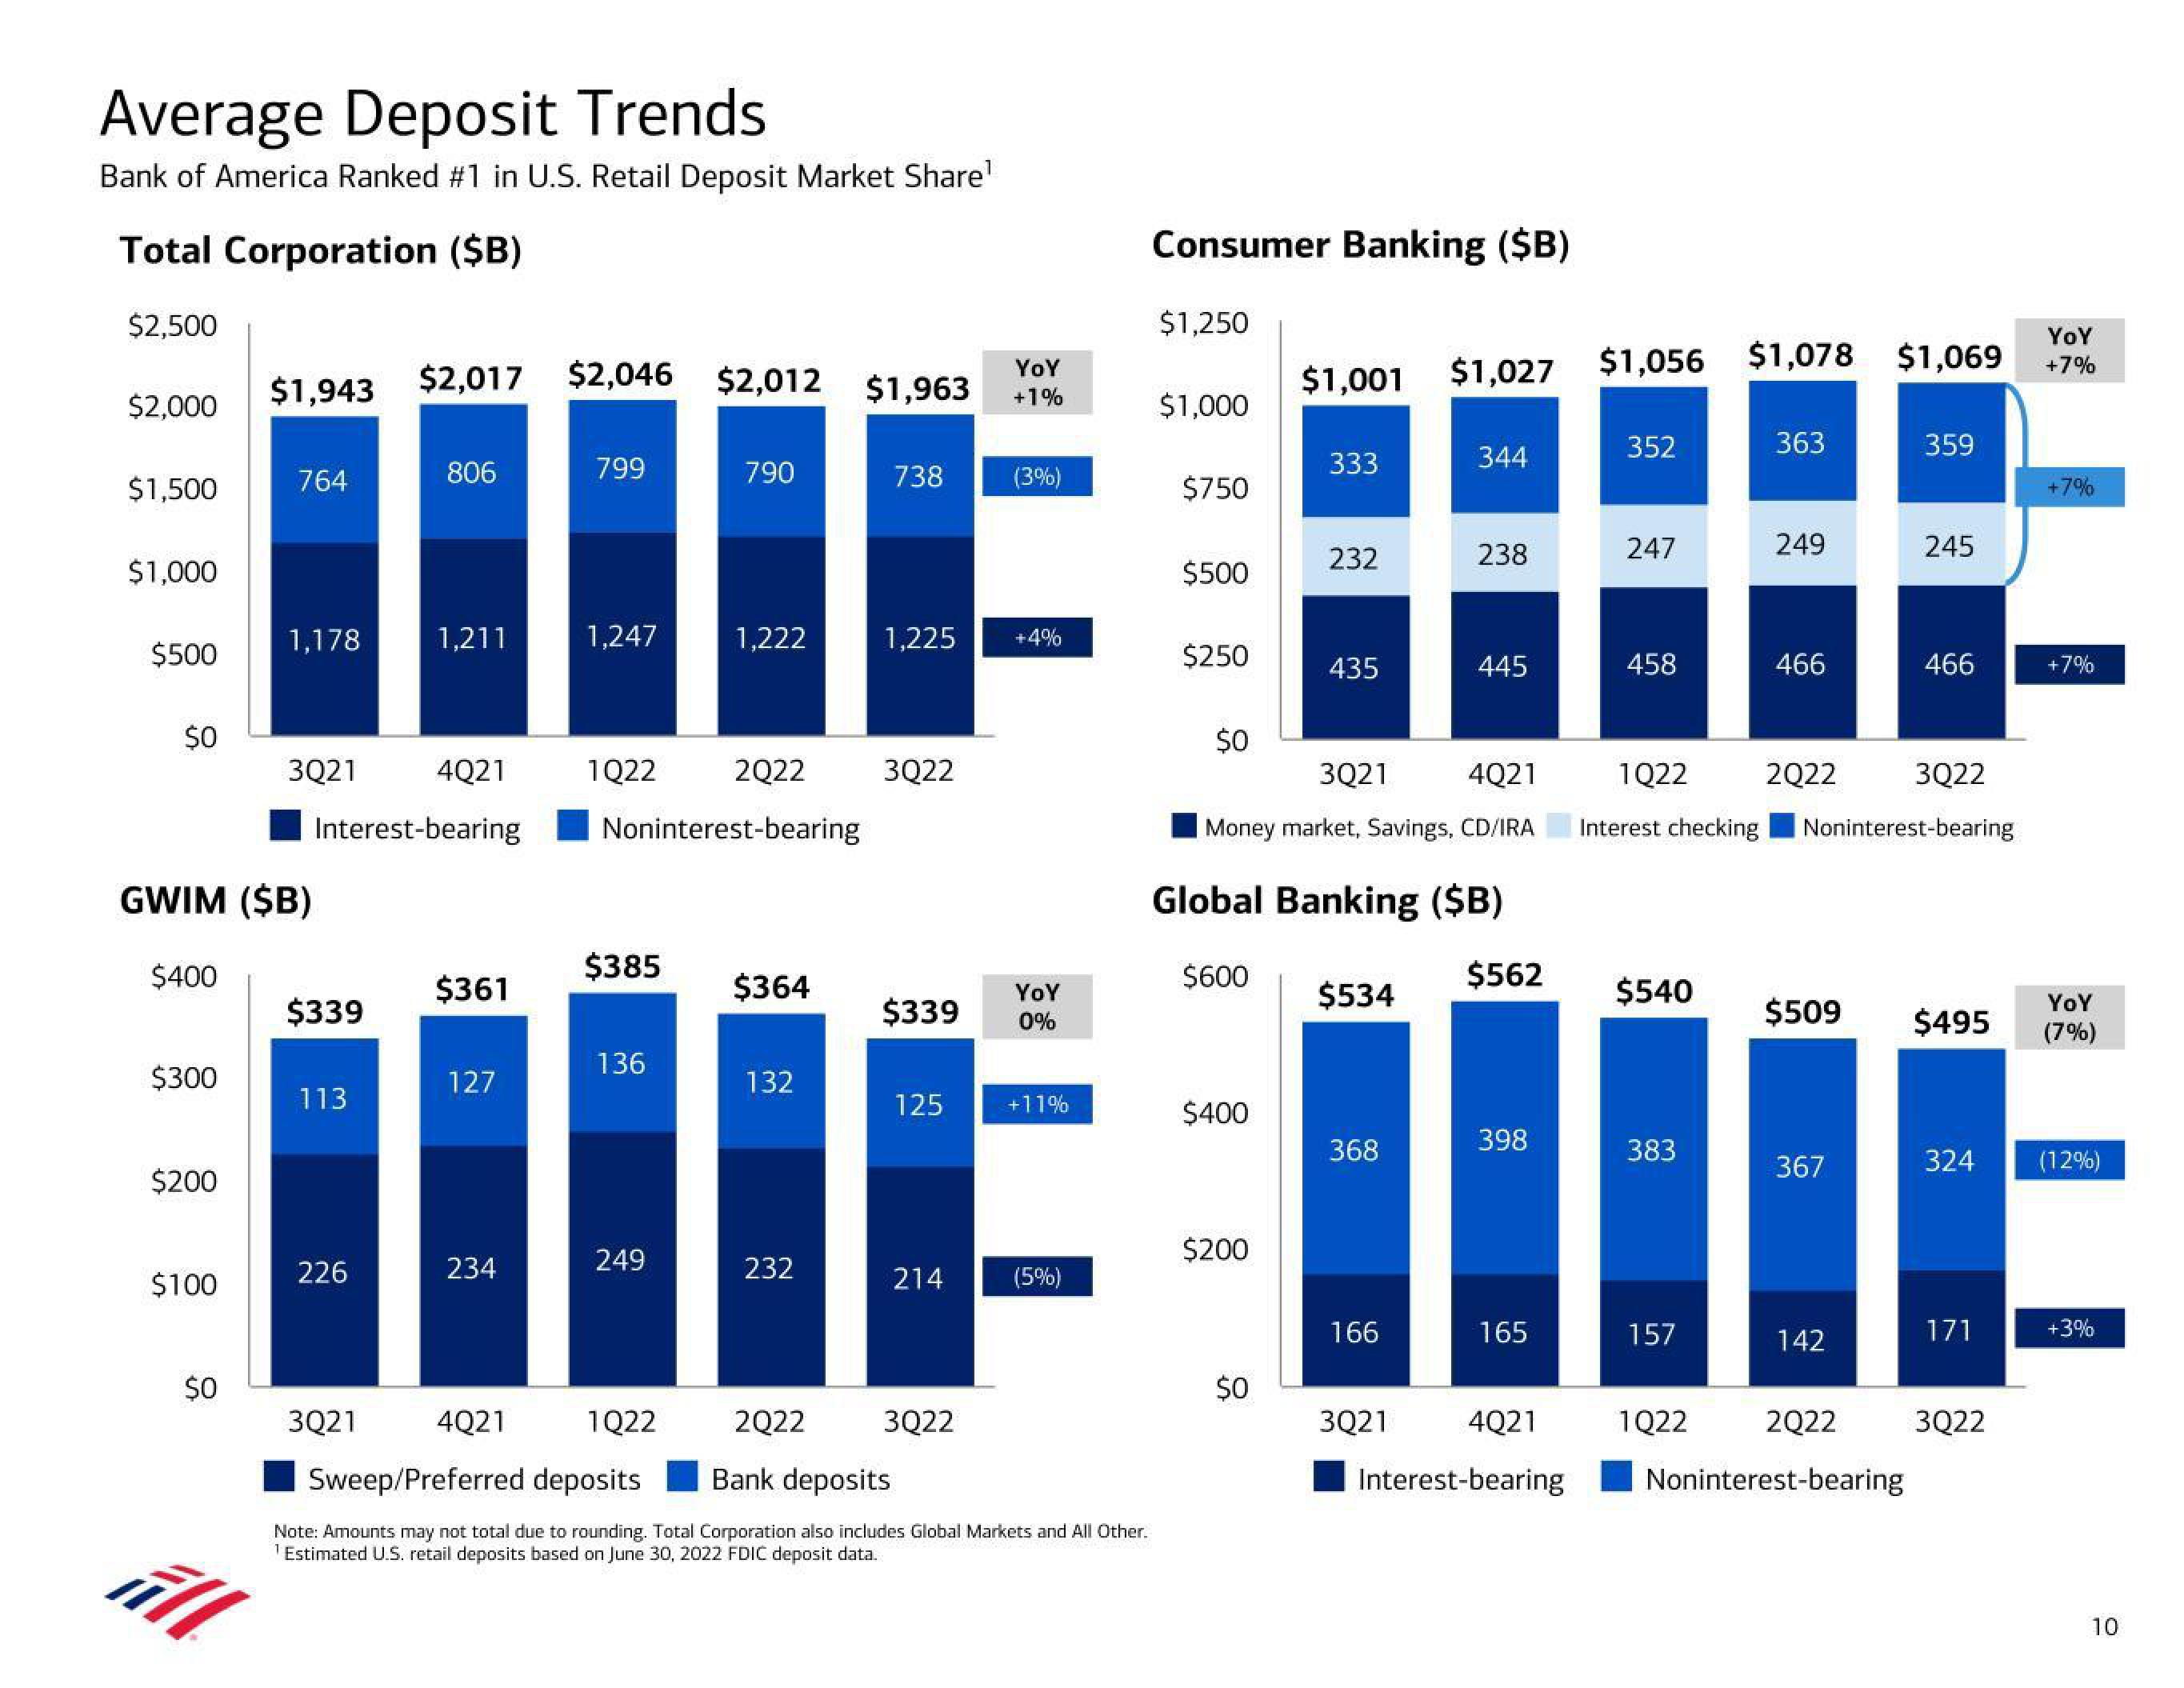
Average Deposit Trends
Bank of America Ranked #1 in U.S. Retail Deposit Market Share¹
Total Corporation ($B)
$2,500
$2,000
$1,500
$1,000
$500
$0
$400
$300
$200
GWIM ($B)
$100
$0
$2,017 $2,046 $2,012 $1,963
$1,943
ill
764
1,178
3Q21
$339
113
Interest-bearing
226
806
1,211
3Q21
4Q21
$361
127
234
799
4Q21
1,247
1Q22
2Q22
Noninterest-bearing
$385
136
790
249
1,222
$364
132
232
738
3Q22
1,225 +4%
$339
YOY
+1%
214
(3%)
125 +11%
3Q22
YOY
0%
1Q22
2Q22
Sweep/Preferred deposits
Bank deposits
Note: Amounts may not total due to rounding. Total Corporation also includes Global Markets and All Other.
¹Estimated U.S. retail deposits based on June 30, 2022 FDIC deposit data.
(5%)
Consumer Banking ($B)
$1,250
$1,000
$750
$500
$250
$0
$400
$1,001 $1,027 $1,056 $1,078 $1,069
$200
333
$0
232
435
3Q21
4Q21
Money market, Savings, CD/IRA
Global Banking ($B)
$600
$534
368
344
166
238
3Q21
445
$562
398
165
4Q21
Interest-bearing
352
247
458
$540
383
363
157
249
466
1Q22
3Q22
Interest checking Noninterest-bearing
2Q22
$509
367
359
142
245
466
$495
324
171
1Q22 2Q22 3Q22
Noninterest-bearing
YOY
+7%
+7%
+7%
YOY
(7%)
(12%)
+3%
10View entire presentation