TPG Investor Presentation Deck
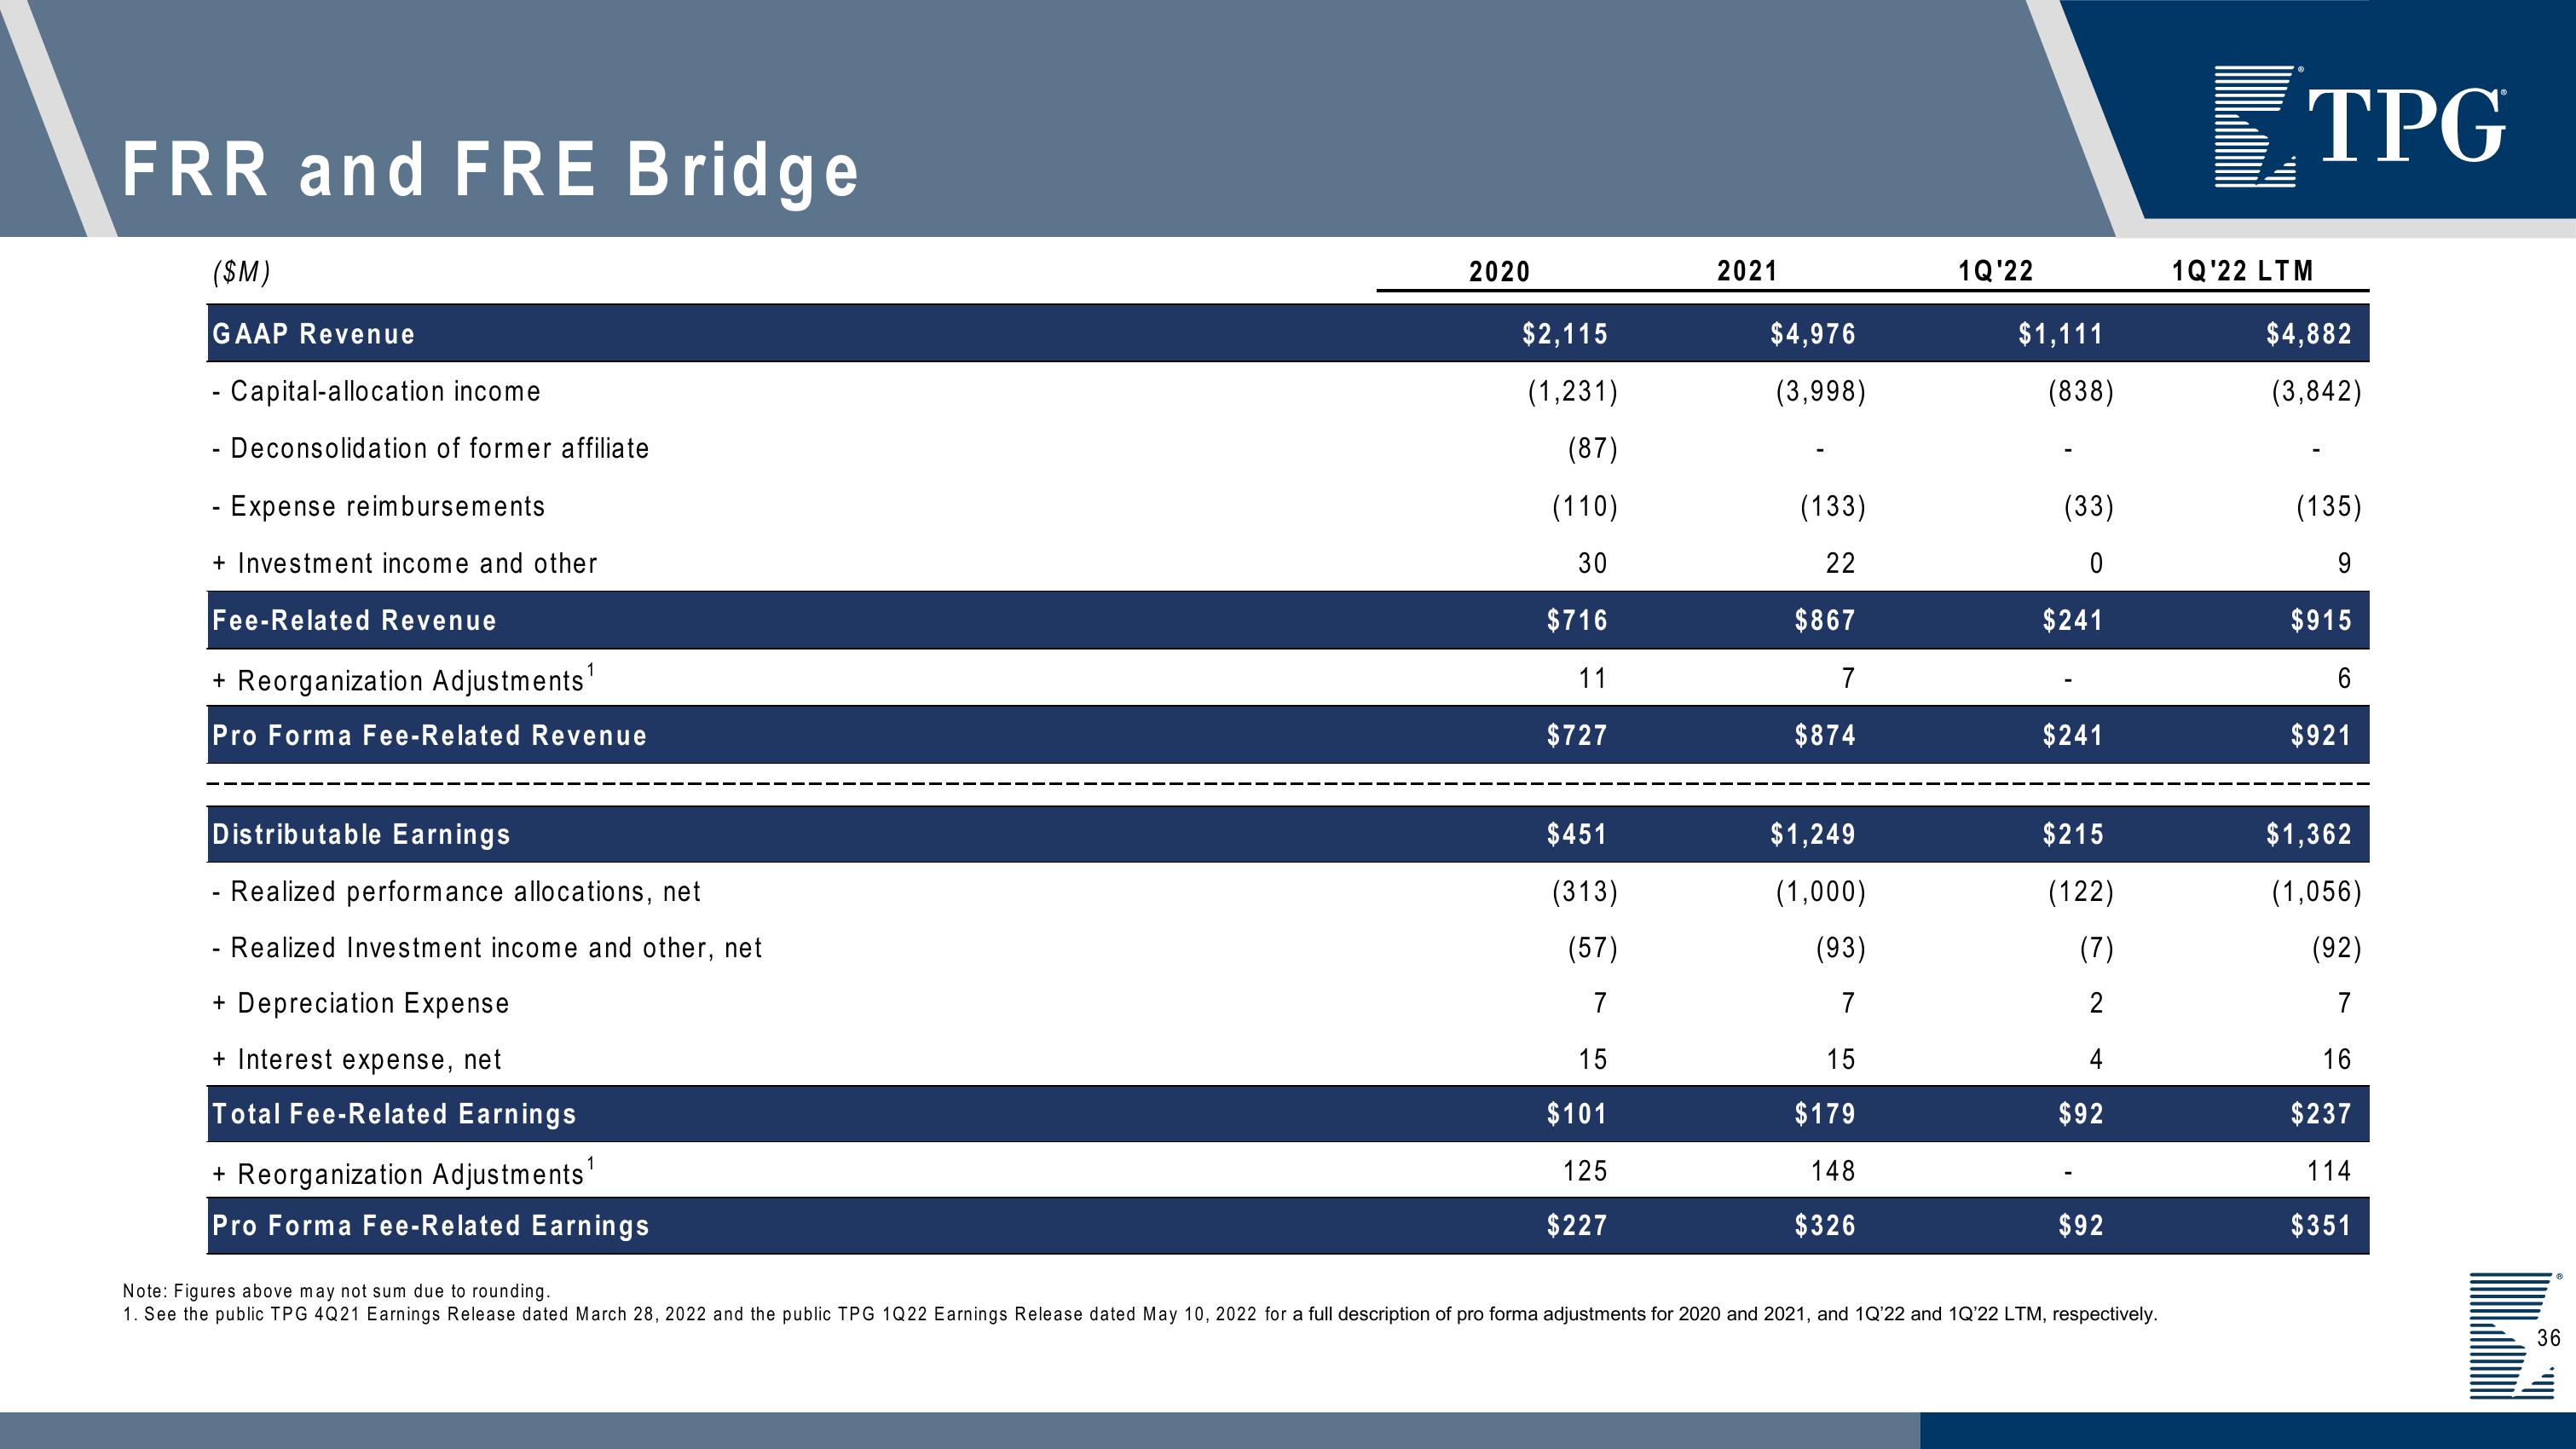
FRR and FRE Bridge
($M)
GAAP Revenue
- Capital-allocation income
- Deconsolidation of former affiliate
- Expense reimbursements
+ Investment income and other
Fee-Related Revenue
+ Reorganization Adjustments¹
Pro Forma Fee-Related Revenue
Distributable Earnings
- Realized performance allocations, net
- Realized Investment income and other, net
+ Depreciation Expense
+ Interest expense, net
Total Fee-Related Earnings
+ Reorganization Adjustments¹
Pro Forma Fee-Related Earnings
2020
$2,115
(1,231)
(87)
(110)
30
$716
11
$727
$451
(313)
(57)
7
15
$101
125
$227
2021
$4,976
(3,998)
(133)
22
$867
7
$874
$1,249
(1,000)
(93)
7
15
$179
148
$326
1Q'22
$1,111
(838)
(33)
0
$241
$241
$215
(122)
(7)
2
4
$92
$92
Note: Figures above may not sum due to rounding.
1. See the public TPG 4Q21 Earnings Release dated March 28, 2022 and the public TPG 1Q22 Earnings Release dated May 10, 2022 for a full description of pro forma adjustments for 2020 and 2021, and 1Q'22 and 1Q'22 LTM, respectively.
TPG
1Q'22 LTM
$4,882
(3,842)
(135)
9
$915
CO
6
$921
$1,362
(1,056)
(92)
7
16
$237
114
$351
36View entire presentation